. 2007 Aug;176(4):2131-8.
doi: 10.1534/genetics.107.074138. Epub 2007 Jun 11.

Predicting and testing physical locations of genetically mapped loci on tomato pachytene chromosome 1

Affiliations

Predicting and testing physical locations of genetically mapped loci on tomato pachytene chromosome 1

Song-Bin Chang et al. Genetics. 2007 Aug.

Abstract

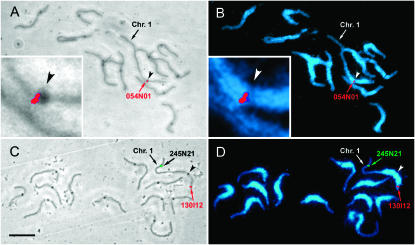
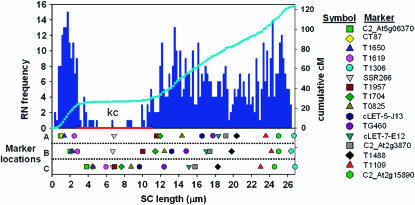
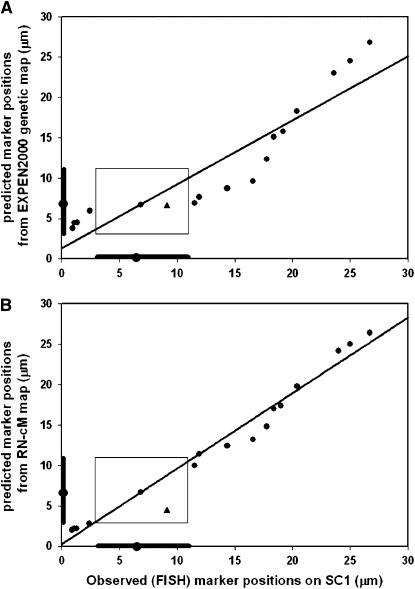
Predicting the chromosomal location of mapped markers has been difficult because linkage maps do not reveal differences in crossover frequencies along the physical structure of chromosomes. Here we combine a physical crossover map based on the distribution of recombination nodules (RNs) on Solanum lycopersicum (tomato) synaptonemal complex 1 with a molecular genetic linkage map from the interspecific hybrid S. lycopersicum x S. pennellii to predict the physical locations of 17 mapped loci on tomato pachytene chromosome 1. Except for one marker located in heterochromatin, the predicted locations agree well with the observed locations determined by fluorescence in situ hybridization. One advantage of this approach is that once the RN distribution has been determined, the chromosomal location of any mapped locus (current or future) can be predicted with a high level of confidence.


Figures

F<sc>igure</sc> 1.—
Figure 1.—
Tomato pachytene SC spreads viewed by phase contrast with superimposed FISH (A and C) and by UV illumination after DAPI staining and superimposed FISH (B and D). The dark spots observed on each SC by phase contrast are kinetochores, and the kinetochore of chromosome 1 is indicated in each image by an arrowhead. Pericentromeric heterochromatin stains more brightly with DAPI than distal euchromatic portions of the chromosomes. The locations of three BACs—054N01 (A and B, red signal), 0245N21 (C and D, green signal), and 130I12 (C and D, red signal) on chromosome 1—are indicated by arrows and text. The centromeric region of chromosome 1 has been enlarged (insets, A and B) to show that the FISH signal for 054N01 (marker SSR266) is located close to the centromere. Bar (A–D), 10 μm.
F<sc>igure</sc> 2.—
Figure 2.—
Comparing predicted and observed marker positions on chromosome 1. (Top) The bar graph shows the distribution of RNs in 0.2-μm intervals along SC 1 that is represented on the x-axis. The short arm is to the left, pericentric heterochromatin is marked with a red bar, and the position of the kinetochore (equals centromere) is marked by “kc.” The light blue line superimposed on the RN distribution represents the cumulative cM value for each interval along the chromosome. (Bottom) The chromosomal positions of markers as observed by FISH (row A), predicted from the RN–cM map (row B), and predicted from the EXPEN 2000 map (row C) are shown. The same markers are shown in each row with a symbol with the same color and shape. The gray inverted triangle represents the SSR266 marker that is located near or at the centromere (see key on the right). The clustering of markers near the centromere in row C is typical of genetic maps in areas of low recombination.
F<sc>igure</sc> 3.—
Figure 3.—
Graphs comparing the observed marker locations by FISH with those predicted from the genetic map (A) and those predicted from the RN–cM map (B). The locations of pericentric heterochromatin and the centromere are indicated by darker bars and a circle, respectively, along the x- and y-axes of each graph. The rectangle in each graph indicates the physical location of pericentric heterochromatin. The TG378 marker is indicated by a triangle and was not included in the regression analyses because it was mapped to the wrong arm. Regression equations are (A) y = 0.792x + 1.35, r2 = 0.849; (B) y = 0.931x + 0.29, r2 = 0.978.

References

    1. Anderson, L. K., S. M. Stack, M. H. Fox and C. Zhang, 1985. The relationship between genome size and synaptonemal complex length in higher plants. Exp. Cell Res. 156: 367–378. - PubMed
    1. Anderson, L. K., A. Reeves, L. M. Webb and T. Ashley, 1999. Distribution of crossing over on mouse synaptonemal complexes using immunofluorescent localization of MLH1 protein. Genetics 151: 1569–1579. - PMC - PubMed
    1. Anderson, L. K., N. Salameh, H. W. Bass, L. C. Harper, W. Z. Cande et al., 2004. Integrating genetic linkage maps with pachytene chromosome structure in maize. Genetics 166: 1923–1933. - PMC - PubMed
    1. Barlow, A. L., and M. A. Hultén, 1998. Crossing over analysis at pachytene in man. European Journal of Human Genetics 6: 350–358. - PubMed
    1. Baudry, E., C. Kerdelhué, H. Innan and W. Stephan, 2001. Species and recombination effects on DNA variability in the tomato genus. Genetics 158: 1725–1735. - PMC - PubMed

Publication types

Substances

LinkOut - more resources