. 2007 Sep;177(1):347-58.
doi: 10.1534/genetics.107.071910. Epub 2007 Jun 11.

Postprocessing of genealogical trees

Affiliations

Postprocessing of genealogical trees

Loukia Meligkotsidou et al. Genetics. 2007 Sep.

Abstract

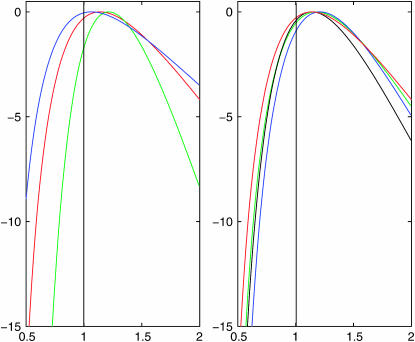
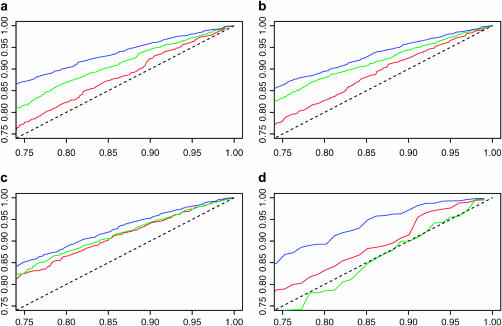
We consider inference for demographic models and parameters based upon postprocessing the output of an MCMC method that generates samples of genealogical trees (from the posterior distribution for a specific prior distribution of the genealogy). This approach has the advantage of taking account of the uncertainty in the inference for the tree when making inferences about the demographic model and can be computationally efficient in terms of reanalyzing data under a wide variety of models. We consider a (simulation-consistent) estimate of the likelihood for variable population size models, which uses importance sampling, and propose two new approximate likelihoods, one for migration models and one for continuous spatial models.


Figures

F<sc>igure</sc> 1.—
Figure 1.—
ESS for analyzing data sets of size m = 10, 15, 20, 30, 40 simulated from the exponentially growing population size model with β = 0.7 and θ = 10, 20, 30.
F<sc>igure</sc> 2.—
Figure 2.—
The coalescent tree for a sample of m = 10 chromosomes from the constant population size model. The mutations are depicted by solid circles on the branches of the tree.
F<sc>igure</sc> 3.—
Figure 3.—
Histograms of the samples of the TMRCA for the coalescent tree analyzed under (a) the constant population size model, (b) the exponentially growing population size model, (c) the constant population size followed by exponential growth model, and (d) the bottleneck model. The true value of the TMRCA is indicated in each plot by a circle.
F<sc>igure</sc> 4.—
Figure 4.—
Contour plot of the mean log-likelihood surface of M12, M21 obtained from 100 simulated coalescent trees with sample size m = 10 under the migration model with D = 2 demes (each contour corresponds to 0.05 units of log-likelihood). The mutation rate used was θ = 30. Shown are the true parameter values, M12 = 1.2 and M21 = 2.8, and the values that maximize the surface, formula image and formula image.
F<sc>igure</sc> 5.—
Figure 5.—
Plots of the log-likelihood surface of σ for a range of parameter values, each obtained from 100 simulated data sets. Left-hand plot: θ = 15, β = 1, and m = 10 (blue); m = 20 (red); and m = 40 (green). Right-hand plot: m = 20, θ = 30, and β = 1 (black); θ = 30, β = 2 (blue); θ = 15, β = 1 (red); and θ = 15, β = 2 (green).
F<sc>igure</sc> 6.—
Figure 6.—
Probability–probability (PP) plots of a formula image-distribution against the likelihood-ratio (LR) statistics for (red) our conditional likelihood method, (blue) analysis conditional on the maximum-likelihood estimate of the coalescence times, and (green) analysis conditional on the true coalescence times. a–c are based on 1000 data sets, with m = 2; β = 1; and (a) θ = 1, (b) θ = 2, and (c) θ = 4. d is based on 100 data sets with m = 5, θ = 2, and β = 1. We simulated all data sets conditional on there being no identical sequences in the data set.

Similar articles

Cited by

References

    1. Bahlo, M., and R. C. Griffiths, 1998. Inference from gene trees in a subdivided population. Theor. Popul. Biol. 57: 79–95. - PubMed
    1. Beerli, P., and J. Felsenstein, 1999. Maximum-likelihood estimation of migration rates and effective population numbers in two populations using a coalescent approach. Genetics 152: 763–773. - PMC - PubMed
    1. Brooks, S. P., I. Manopoulou and B. C. Emerson, 2007. Assessing the affect of genetic mutation: a Bayesian framework for determining population history from DNA sequence data, pp. 25–50 in Bayesian Statistics 8, edited by J. M. Bernardo, M. J. Bayarri, J. O. Berger, A. P. Dawid, D. Heckerman, A. F. M. Smith and M. West. Oxford University Press, Oxford.
    1. Coop, G., and R. C. Griffiths, 2004. Ancestral inference on gene trees under selection. Theor. Popul. Biol. 66: 219–232. - PubMed
    1. Didelot, X., and D. Falush, 2007. Inference of bacterial microevolution using multilocus sequence data. Genetics 175: 1251–1266. - PMC - PubMed

Publication types