. 2007 Aug;176(4):2441-9.
doi: 10.1534/genetics.106.068585. Epub 2007 Jun 11.

Testing the extreme value domain of attraction for distributions of beneficial fitness effects

Affiliations

Testing the extreme value domain of attraction for distributions of beneficial fitness effects

Craig J Beisel et al. Genetics. 2007 Aug.

Abstract

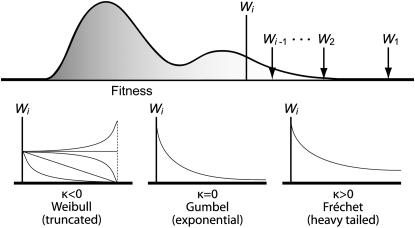
In modeling evolutionary genetics, it is often assumed that mutational effects are assigned according to a continuous probability distribution, and multiple distributions have been used with varying degrees of justification. For mutations with beneficial effects, the distribution currently favored is the exponential distribution, in part because it can be justified in terms of extreme value theory, since beneficial mutations should have fitnesses in the extreme right tail of the fitness distribution. While the appeal to extreme value theory seems justified, the exponential distribution is but one of three possible limiting forms for tail distributions, with the other two loosely corresponding to distributions with right-truncated tails and those with heavy tails. We describe a likelihood-ratio framework for analyzing the fitness effects of beneficial mutations, focusing on testing the null hypothesis that the distribution is exponential. We also describe how to account for missing the smallest-effect mutations, which are often difficult to identify experimentally. This technique makes it possible to apply the test to gain-of-function mutations, where the ancestral genotype is unable to grow under the selective conditions. We also describe how to pool data across experiments, since we expect few possible beneficial mutations in any particular experiment.


Figures

F<sc>igure</sc> 1.—
Figure 1.—
An illustration of the different possible tail behaviors corresponding to the three domains of attraction under extreme value theory. The top describes a general fitness distribution of all genotypes within one mutational step of the wild type, with wild-type fitness given by Wi. We are interested in the distribution of values bigger than Wi. The bottom shows hypothetical examples of the three alternative tail distributions.
F<sc>igure</sc> 2.—
Figure 2.—
The impact of missing small-effect mutations on the type I error for the LRT. Values were simulated from a shifted exponential. The horizontal axis represents the shift, measured as a fraction of the mean fitness effect. The vertical axis represents the true type I error for the likelihood-ratio test when one fails to account for the shift. One hundred thousand replicate tests were performed for each point.
F<sc>igure</sc> 3.—
Figure 3.—
The power of the GPD likelihood-ratio test. The null hypothesis is the exponential distribution corresponding to κ = 0 and the type I error was set at α = 0.05. Power was calculated for the test for sample sizes of n = 10, 20, 30, 50, and 100. Critical values of the test statistic were estimated by 10 million simulations. One million replicate tests were performed for each point and power was taken as the percentage of tests that correctly rejected the null hypothesis.
F<sc>igure</sc> 4.—
Figure 4.—
The impact of ignoring measurement error. Data were simulated under the exponential distribution and both normal errors (A) and lognormal (B) were included in the simulations of each data set. The likelihood-ratio test was performed for the exponential against a GPD ignoring measurement error in the data. The type I error was plotted against the coefficient of variation for the distribution of measurement error.

References

    1. Bull, J. J., M. R. Badgett and H. A. Wichman, 2000. Big-benefit mutations in a bacteriophage inhibited with heat. Mol. Biol. Evol. 17: 942–950. - PubMed
    1. Castillo, E., 1988. Extreme Value Theory in Engineering. Academic Press, New York/London/San Diego.
    1. Castillo, E., and A. S. Hadi, 1997. Fitting the generalized Pareto distribution to data. J. Am. Stat. Assoc. 92: 1609–1620.
    1. Cowperthwaite, M. C., J. J. Bull and L. Ancel Myers, 2005. Distributions of beneficial fitness effects. Genetics 170: 1449–1457. - PMC - PubMed
    1. Davison, A. C., and R. L. Smith, 1990. Models for exceedances over high thresholds. J. R. Stat. Soc. Ser. B 52: 393–442.

Publication types