

doi: 10.1098/rsif.2007.1070.
A model for glioma cell migration on collagen and astrocytes
Affiliations
- PMID: 17567554
- PMCID: PMC2605504
- DOI: 10.1098/rsif.2007.1070
Item in Clipboard
A model for glioma cell migration on collagen and astrocytes
J R Soc Interface.
.
Abstract
We present a model for the migration of glioma cells on substrates of collagen and astrocytes. The model is based on a cellular automaton where the various dynamical effects are introduced through adequate evolution rules. Using our model, we investigate the role of homotype and heterotype gap junction communication and show that it is possible to reproduce the corresponding experimental migration patterns. In particular, we confirm the experimental findings that inhibition of homotype gap junctions favours migration while heterotype inhibition hinders it. Moreover, the effect of heterotype gap junction inhibition dominates that of homotype inhibition.
Figures
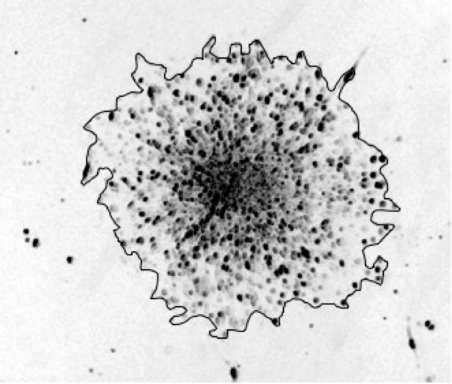
Experimental cell migration pattern over 48 h with CBX on collagen IV with the envelope of the surface.

Example of possible cell moves for migration over a monolayer of astrocytes. A dark grey hexagon denotes the presence of a cell and a light grey hexagon denotes the presence of an astrocyte. The cell does not move on to a site occupied by a tumour cell. In the case of maximal attraction between tumour cells and astrocytes the cell can only move next to a site occupied by a tumour cell (dashed line) or on a site with an astrocyte (full line).
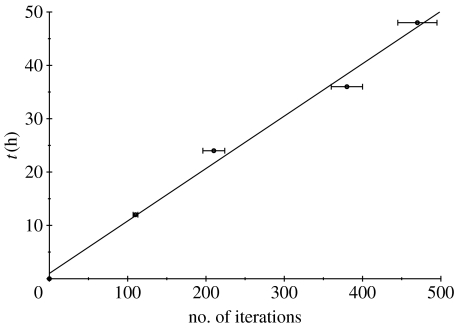
Physical time with error bars (due to the mixed s.d. between experiments and simulations) as a function of the automaton iterations. The straight line represents the best linear fit.
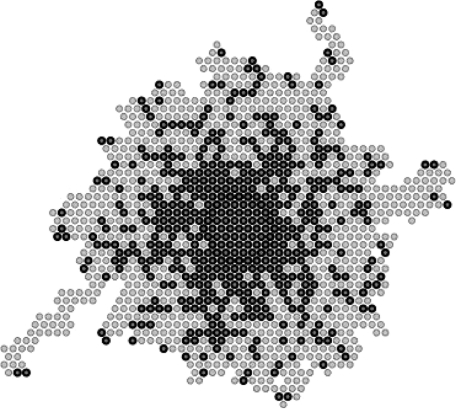
Simulated cell migration pattern (dark grey) and the corresponding surface (light grey) after 48 h for migration on collagen in the case of maximal attraction between tumour cells (with p=1).
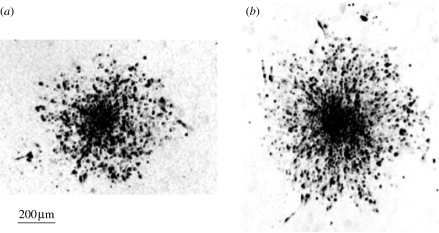
Experimental cell migration patterns after 48 h of migration over a substrate of collagen (a) in the control situation and (b) in the situation with inhibited GJs.
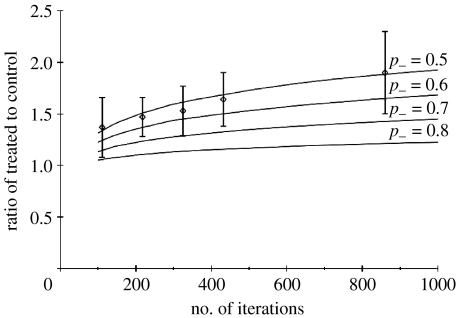
Comparison between experimental data (diamonds) with error bars (values at times 12, 24, 36, 48 h and 4 days after the beginning of migration) and simulated ratio of treated-to-control surfaces as a function of number of iterations, for various values of p−. The standard deviation for the model (not represented in the figure) is equal to 0.18 for all times.
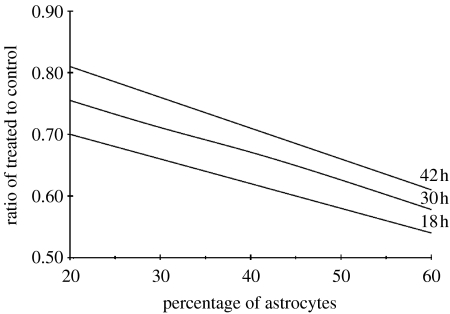
Simulated ratio of treated-to-control surfaces as a function of the percentage of astrocytes after 18, 30 and 42 h of migration. The standard deviation for the model (not represented in the figure) is equal to 0.06 for all times.
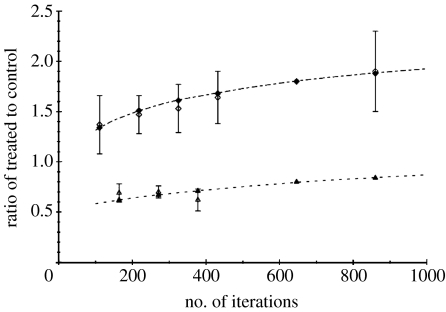
Comparison of the experimental data (filled symbols with error bars) with the results of the automaton (open symbols) as a function of the number of iterations of the automaton, in the case of migration on a substrate of collagen (diamonds) and migration over a monolayer of astrocytes (triangles). For all times, the standard deviations for the model (not represented in the figure) are equal to 0.18 for migration on a substrate of collagen and 0.06 for migration on astrocytes.
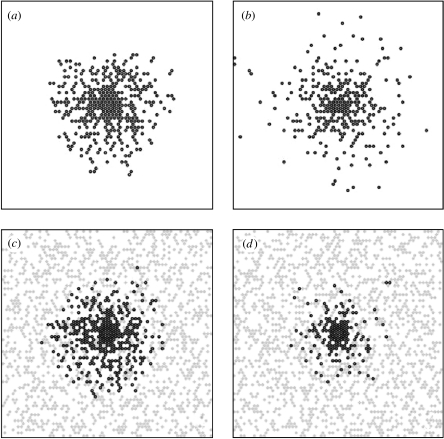
Cell migration patterns after 48 h for simulated migration on a substrate of collagen (a) in the control situation, (b) with inhibited GJs and after 42 h for simulated migration over a monolayer of astrocytes, (c) in the control situation, (d) with inhibited GJs. A dark grey circle denotes the presence of a tumour cell and a grey rhombus denotes the presence of an astrocyte.
References
-
- Aronica E, Gorter J.A, Jansen G.H, Leenstra S, Yankaya B, Troost D. Expression of connexin 43 and connexin 32 gap-junction proteins in epilepsy-associated brain tumors and in the perilesional epileptic cortex. Acta Neuropathol. 2001;101:449–459. - PubMed
-
- Chicoine M.R, Silbergeld D.L. Assessment of brain tumor cell motility in vivo and in vitro. J. Neurosurg. 1995;82:615–622. - PubMed
-
- De Bouard S, et al. Invasion of human glioma biopsy specimens in cultures of rodent brain slices: a quantitative analysis. J. Neurosurg. 2002;97:169–176. - PubMed
MeSH terms
Substances
LinkOut - more resources
Full Text Sources
Miscellaneous