. 2007;35(12):4164-78.
doi: 10.1093/nar/gkm387. Epub 2007 Jun 12.

PLP/DM20 ratio is regulated by hnRNPH and F and a novel G-rich enhancer in oligodendrocytes

Affiliations

PLP/DM20 ratio is regulated by hnRNPH and F and a novel G-rich enhancer in oligodendrocytes

Erming Wang et al. Nucleic Acids Res. 2007.

Abstract

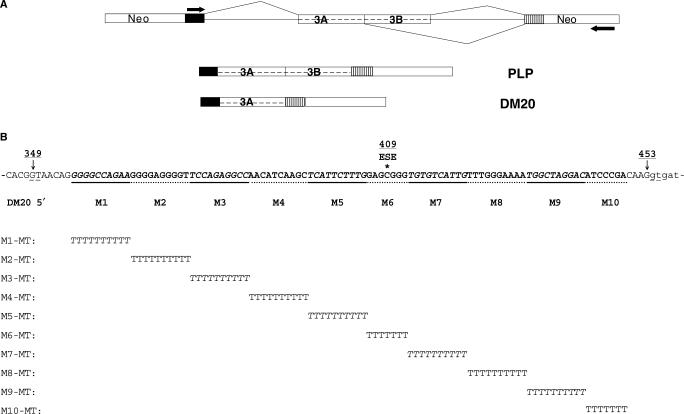
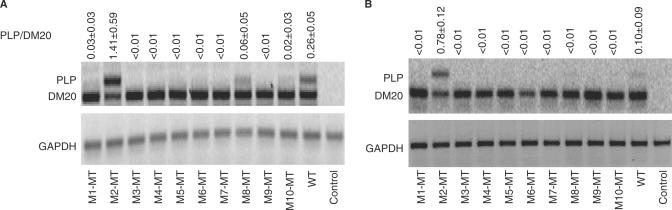
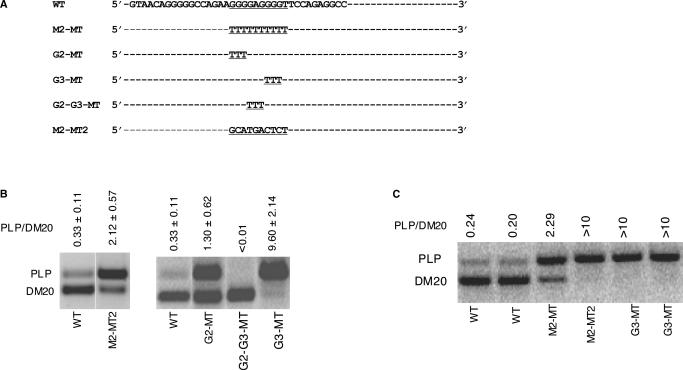
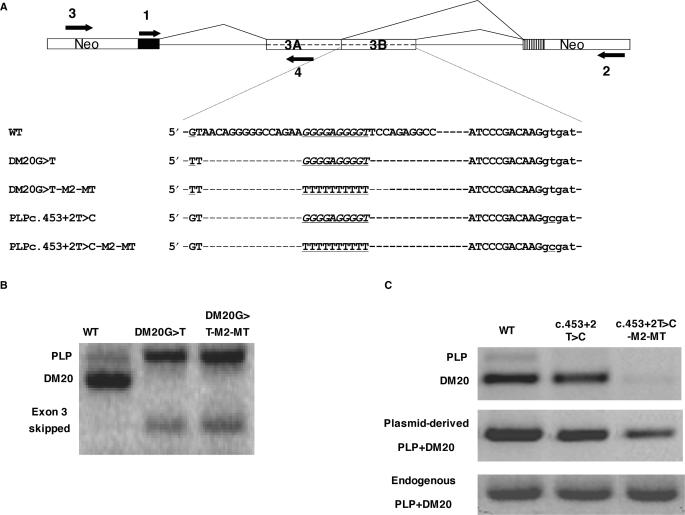
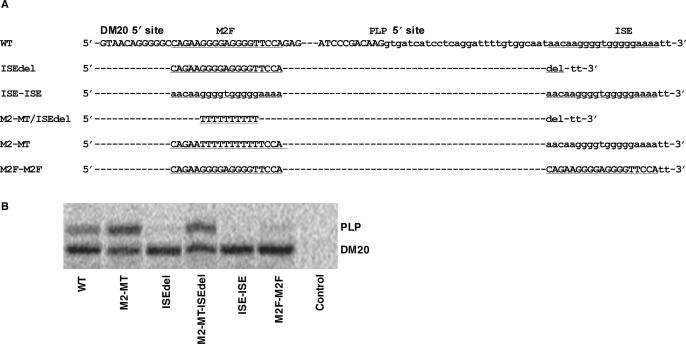
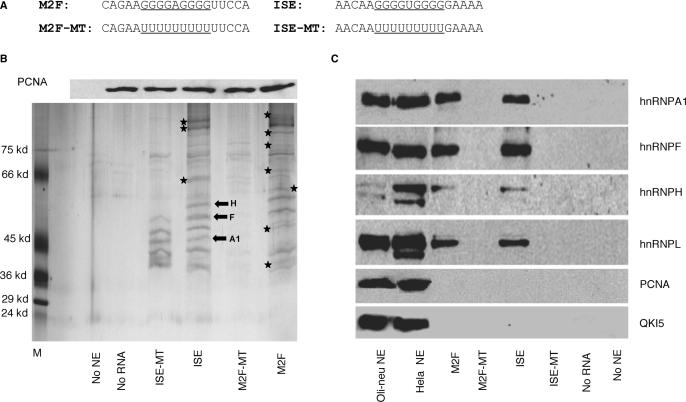
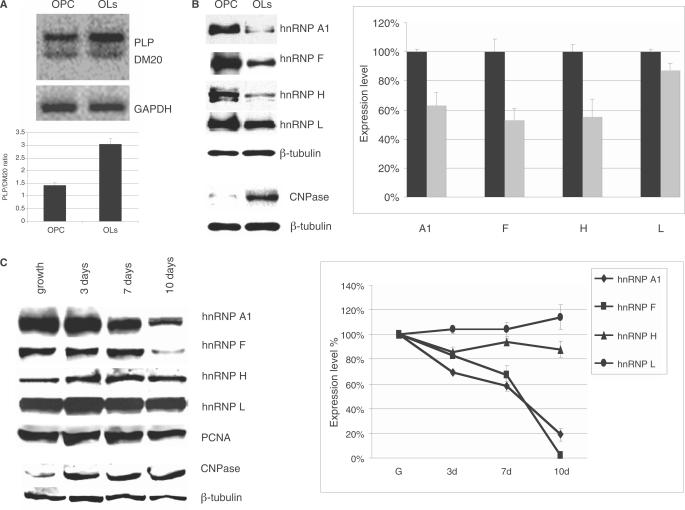
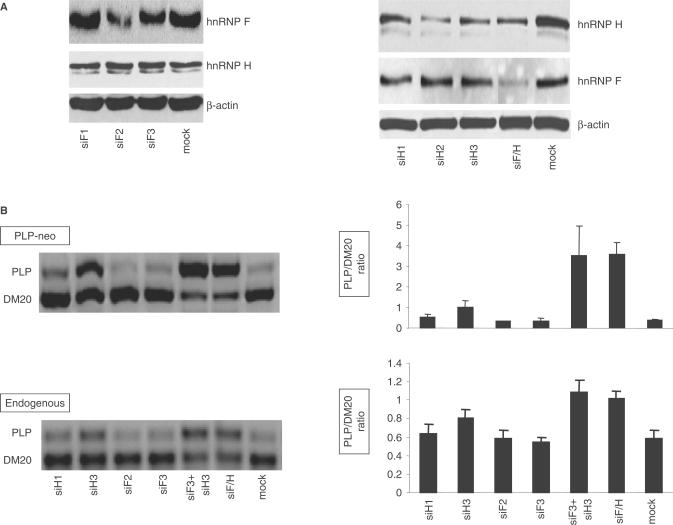
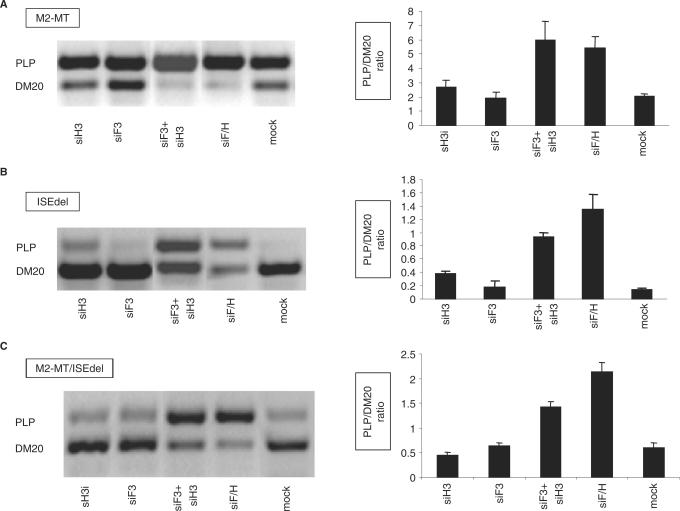
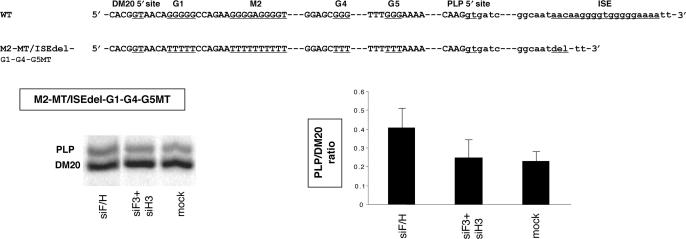
Alternative splicing of competing 5' splice sites is regulated by enhancers and silencers in the spliced exon. We have characterized sequences and splicing factors that regulate alternative splicing of PLP and DM20, myelin proteins produced by oligodendrocytes (OLs) by selection of 5' splice sites in exon 3. We identify a G-rich enhancer (M2) of DM20 5' splice site in exon 3B and show that individual G triplets forming M2 are functionally distinct and the distal group plays a dominant role. G-rich M2 and a G-rich splicing enhancer (ISE) in intron 3 share similarities in function and protein binding. The G-rich sequences are necessary for binding of hnRNPs to both enhancers. Reduction in hnRNPH and F expression in differentiated OLs correlates temporally with increased PLP/DM20 ratio. Knock down of hnRNPH increased PLP/DM20 ratio, while hnRNPF did not. Silencing hnRNPH and F increased the PLP/DM20 ratio more than hnRNPH alone, demonstrating a novel synergistic effect. Mutation of M2, but not ISE reduced the synergistic effect. Replacement of M2 and all G runs in exon 3B abolished it almost completely. We conclude that developmental changes in hnRNPH/F associated with OLs differentiation synergistically regulate PLP alternative splicing and a G-rich enhancer participates in the regulation.


Figures

Figure 1.
Figure 1.
PLP-neo construct and mutations in PLP exon 3B. (A) Schematic representation of the PLP-neo splicing construct. The arrows indicate the position of the PCR primers. The PLP and DM20 PCR products are shown. (B) Exon 3B: 349 indicates G at the invariant GT of DM20 5′ splice site, 453 is the last base of exon 3B at the PLP 5′ splice site, 409 is the position of a human mutation occurring in an ASF/SF2 motif and ESE indicates the ASF/SF2 binding motif (16). The linker scan sequence substitutions are aligned below the wild-type sequences. All mutant constructs replace 10 nt, except for M6 and M10 (see text), and are of the same length as the wild-type construct.
Figure 2.
Figure 2.
Mutation of a G-rich sequence activates inclusion of PLP exon 3B. Results of RT-PCR assay of PLP and DM20 from total RNA isolated from Oli-neu cells (30 PCR cycles) (A) and L cells (35 PCR cycles) (B) transfected with wild-type PLP-neo (WT) and M1-MT to M10-MT. The PLP/DM20 ratios ± SD are shown (n = 3). GAPDH is used for accuracy of RNA loading (25 PCR cycles). Control represents the untransfected cells. The increase in PLP/DM20 ratio with the M2-MT construct is statistically significant (P = 0.017 for Oli-neu cells and P < 0.002 for L cells).
Figure 3.
Figure 3.
Analysis of G triplets within M2 in Oli-neu cells and primary oligodendrocytes. (A) Partial wild-type sequences of exon 3B are shown and M2 is underlined. Linker scan mutations of M2 and G triplets within M2 are shown. (B) Results of RT-PCR assay of PLP and DM20 from RNA isolated from differentiated Oli-neu cells transfected with wild-type PLP-neo (WT) and mutated constructs, M2-MT, M2-MT2, G2-MT, G3-MT and G2-G3-MT. The PLP/DM20 ratios ± SD are shown (n = 3). The upper and lower limits of accurate quantification of the PLP/DM20 ratio are 10 and 0.01. (C) PLP and DM20 PCR products amplified in RNA extracted from differentiated OLs transfected with WT and M2-MT, M2-MT2 and G3-MT, duplicate transfections are shown.
Figure 4.
Figure 4.
M2 is an enhancer of DM20 5′ splice site selection. (A) PLP-neo construct and primers used for PCR amplification. Partial sequences of the natural exon 3B (WT) and mutated constructs are shown, underlined are mutations at the DM20 and PLP 5′ splice site and the M2-MT. (B) PLP and DM20 PCR products (35 PCR cycles) from WT and DM20 G>T and DM20 G>T-M2-MT amplified with primers 1 and 2 in RNA extracted from transfected Oli-neu cells. (C) PLP and DM20 PCR products (35 PCR cycles) derived from WT, c.453+2T>C and c.453T>C-M2-MT amplified with primers 1 and 2 in RNA extracted from Oli-neu cells. Plasmid-derived PLP+DM20 PCR product was amplified with primers 3 and 4 and represents the total plasmid-derived PLP/DM20 transcript. Endogenous PLP+DM20 PCR product amplified with primers 1 and 4 is the control for RNA loading.
Figure 5.
Figure 5.
Functional analysis of M2 and ISE. (A) Partial sequences of exon 3B: M2 and ISE (small cases) are underlined. The mutations and the name of the constructs are shown (see text for details). (B) Results of RT-PCR assay of PLP and DM20 from differentiated Oli-neu cells transfected with wild-type PLP-neo (WT) and mutant constructs, M2-MT, ISEdel, M2-MT-ISEdel, ISE-ISE and M2F-M2F. This is a representative experiment (n = 2).
Figure 6.
Figure 6.
Biochemical analysis of proteins that bind to M2F and ISE in Oli-neu extracts. (A) RNA templates used in RNA affinity precipitations. The natural G-rich sequences and the mutated poly-U sequences are underlined. (B) Upper panel: Western blot analysis of PCNA levels in each RNA affinity precipitate. One-tenth of each RNA/protein mixture prior to streptavidin beads precipitation was separated by SDS-PAGE and probed with an antibody to PCNA. Lower panel: representative silver stained gel of RNA affinity precipitates with biotinylated RNA templates containing wild-type (M2F and ISE), poly-U (M2F-MT and ISE-MT) and Oli-neu extracts (n = 2) (see Materials and Methods section). Controls are precipitates without nuclear extracts (no NE) and without RNA template (no RNA). The asterisks indicate protein bands that are uniquely present in precipitates with either M2F or ISE. The block arrows indicate the protein bands that were analyzed by LC/MS/MS and their identity is shown. (C). Western blot analysis of hnRNPA1, F, H and L in the RNA affinity precipitates (see Materials and Methods Section). Precipitates without nuclear extracts (no NE) and without RNA template (no RNA) are used as controls. Western blot of Oli-neu and HeLa nuclear extracts (9 μg) were used as control for the reactivity of the antibody. PCNA and QKI5 antibodies, used as control of the specificity of RNA affinity precipitates, detect a band in the nuclear extracts, but not in the RNA affinity precipitates.
Figure 7.
Figure 7.
The hnRNPs expression in primary OLs and Oli-neu cells. (A) Representative RT-PCR products of the endogenous PLP and DM20 transcripts in RNA isolated from OPC and OLs differentiated for 72 h. The bar graph represents the mean ± SD (n = 3). (B) Representative Western blot of nuclear extracts prepared from OPC and OLs differentiated for 72 h and probed with antibodies specific for hnRNPA1, H, F and L (see Materials and Methods section). CNPase expression was assessed in cytoplasmic extracts. Tubulin is a control for loading accuracy. The data were reproduced in five separate primary OLs preparations. Bands were quantified by densitometry and the value was corrected by the internal control tubulin. The bar graph represents the percent expression ± SD of each protein in OLs nuclear extracts relative to the level detected in OPC nuclear extracts, which is set at 100 (n = 5). Reduction of H (P = 0.006), F (P = 0.003) and A1 (P = 0.02) in differentiated OLs versus OPC were all significant. (C) Representative Western blot of nuclear extracts prepared from undifferentiated Oli-neu cells (growth) and differentiated for 3, 7 and 10 days and probed with antibodies specific for hnRNPA1, H, F and L. Tubulin is control for loading accuracy. The data were reproduced in three separate experiments. Bands were quantified by densitometry and the values were corrected by the internal control tubulin. CNPase expression was assessed in cytoplasmic extracts. The bar graph represents the percent expression ± SD of each protein in the Oli-neu nuclear extracts relative to the level detected in undifferentiated cells, which is set at 100 (n = 3). The reduction of F and A1 expression in differentiated Oli-neu cells was significant at 7 and 10 days versus undifferentiated Oli-neu cells (P = 0.0017 for F and P = 0.001 for A1). The decrease of H in differentiated Oli-neu cells versus undifferentiated Oli-neu cells did not reach statistical significance. Levels of hnRNPL did not change.
Figure 8.
Figure 8.
RNAi-mediated knock down of hnRNPH and F increases the PLP/DM20 ratio in Oli-neu cells. (A) Representative Western blot of cell extracts prepared from Oli-neu cells treated with siRNAs that target hnRNPH (siH1, H2, H3), hnRNPF (siF1, F2 and F3) and both H and F (siF/H). Mock are cells treated with negative control siRNA. After quantification of the bands, the values were corrected by actin, used as control for loading accuracy. The hnRNPH was reduced by 40, 70 and 50% in cells treated with siH1, siH2 and siH3 and 50% in cells treated with siH/F versus control (n = 2). The hnRNPF was reduced by 60 and 40% in cells treated with siF2 and siF3 and by 60% in cells treated with siF/H versus controls. (B) Representative RT-PCR analysis of the PLP-neo derived PLP and DM20 spliced products and the endogenous PLP and DM20 transcripts amplified from RNA isolated from Oli-neu cells treated with siH1, siH3, siF2, siF3, siF3 + H3 and siF/H (35 PCR cycles). The bar graph shows the PLP/DM20 ratios ± SD (n = 3). Mock are cells treated with control siRNA. Increase in PLP/DM20 ratio is statistically significant for siH3 (P < 0.05) and for siF3+H3 and siF/H (P < 0.01)-treated cells compared with mock-treated cells.
Figure 9.
Figure 9.
The effect of mutation of M2 and ISE on the hnRNPH and F-mediated regulation of PLP/DM20. (A) Representative RT-PCR analysis of the M2-MT derived PLP and DM20 products amplified from RNA isolated from Oli-neu cells treated with siH3, siF3, siF3+H3, siF/H (35 PCR cycles). Mock are cells treated with control siRNA. The bar graph shows the PLP/DM20 ratios ± SD (n = 3). The increase in PLP/DM20 ratio induced by siF3+H3 and siF/H are statistically significant (P < 0.01). (B) Representative RT-PCR analysis of the ISEdel derived PLP and DM20 products amplified from RNA prepared from Oli-neu cells treated with siH3, siF3, siF3+H3, siF/H (35 PCR cycles). Mock are cells treated with control siRNA. The bar graph shows the PLP/DM20 ratios ± SD (n = 3). The increase in PLP/DM20 ratio induced by siH3, siF3+H3 and siF/H is statistically significant (P < 0.01). (C) Representative RT-PCR analysis of the M2-MT/ISEdel derived PLP and DM20 products amplified from RNA prepared from Oli-neu cells treated with siH3, siF3, siF3+H3, siF/H (35 PCR cycles). Mock are cells treated with control siRNA. The bar graph shows the PLP/DM20 ratios ± SD (n = 3). The changes in PLP/DM20 ratio induced by siF3+H3 and siF/H are statistically significant (P < 0.05).
Figure 10.
Figure 10.
The effect of mutation of G1, G4 and G5 on the hnRNPH and F-mediated regulation of PLP/DM20. (A) Partial sequences of PLP exon 3B/intron 3 (WT) and of mutations of M2/ISE and G1, G4 and G5 in exon 3B (M2-MT/ISEdel-G1-G4-G5MT) are shown. (B) Representative RT-PCR analysis of the M2-MT/ISEdel-G1-G4-G5MT derived PLP and DM20 products amplified from RNA isolated from Oli-neu cells treated with siF3+H3, siF/H (35 PCR cycles). Mock are cells transfected with M2-MT/ISEdel-G1-G4-G5MT and treated with control siRNA. The bar graph shows the PLP/DM20 ratios ± SD (n = 3).

References

    1. Modrek B, Lee CJ. Alternative splicing in the human, mouse and rat genomes is associated with an increased frequency of exon creation and/or loss. Nat. Genet. 2003;34:177–180. - PubMed
    1. Sugnet CW, Kent WJ, Ares M, Jr, Haussler D. Transcriptome and genome conservation of alternative splicing events in humans and mice. Pac. Symp. Biocomput. 2004:66–77. - PubMed
    1. Matlin AJ, Clark F, Smith CW. Understanding alternative splicing: towards a cellular code. Nat. Rev. Mol. Cell Biol. 2005;6:386–398. - PubMed
    1. Wang Z, Xiao X, Van Nostrand E, Burge CB. General and specific functions of exonic splicing silencers in splicing control. Mol. Cell. 2006;23:61–70. - PMC - PubMed
    1. Black DL, Grabowski PJ. Alternative pre-mRNA splicing and neuronal function. Prog. Mol. Subcell. Biol. 2003;31:187–216. - PubMed

Publication types

MeSH terms