. 2007 Jul;16(7):1257-65.
doi: 10.1110/ps.062726807. Epub 2007 Jun 13.

o-Nitrotyrosine and p-iodophenylalanine as spectroscopic probes for structural characterization of SH3 complexes

Affiliations

o-Nitrotyrosine and p-iodophenylalanine as spectroscopic probes for structural characterization of SH3 complexes

Vincenzo De Filippis et al. Protein Sci. 2007 Jul.

Abstract

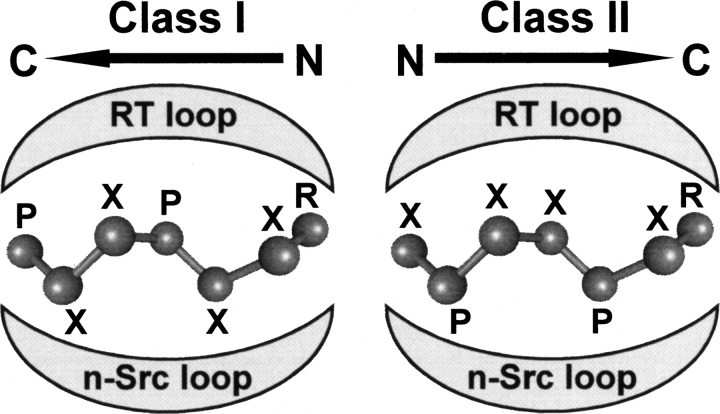
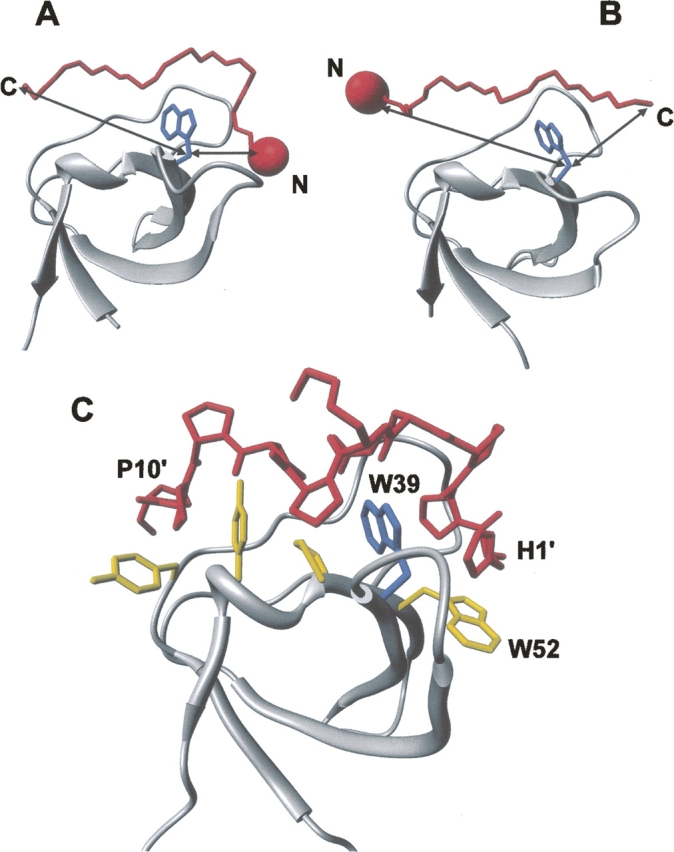
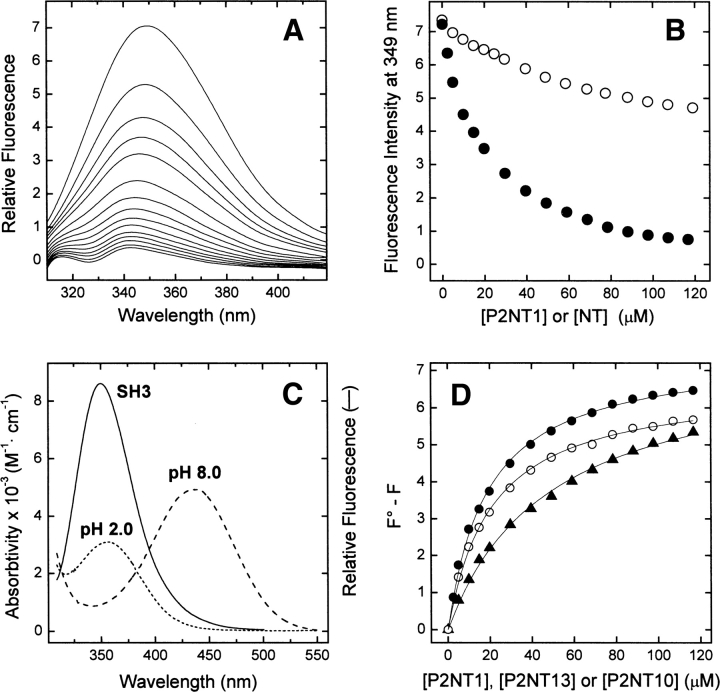
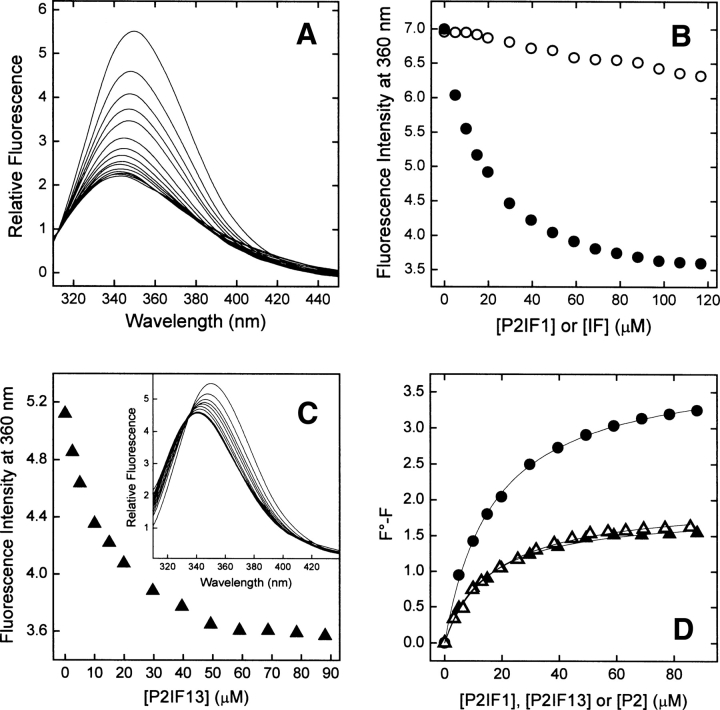
High-throughput screening of protein-protein and protein-peptide interactions is of high interest both for biotechnological and pharmacological applications. Here, we propose the use of the noncoded amino acids o-nitrotyrosine and p-iodophenylalanine as spectroscopic probes in combination with circular dichroism and fluorescence quenching techniques (i.e., collisional quenching and resonance energy transfer) as a means to determine the peptide orientation in complexes with SH3 domains. Proline-rich peptides bind SH3 modules in two alternative orientations, according to their sequence motifs, classified as class I and class II. The method was tested on an SH3 domain from a yeast myosin that is known to recognize specifically class I peptides. We exploited the fluorescence quenching effects induced by o-nitrotyrosine and p-iodophenylalanine on the fluorescence signal of a highly conserved Trp residue, which is the signature of SH3 domains and sits directly in the binding pocket. In particular, we studied how the introduction of the two probes at different positions of the peptide sequence (i.e., N-terminally or C-terminally) influences the spectroscopic properties of the complex. This approach provides clear-cut evidence of the orientation of the binding peptide in the SH3 pocket. The chemical strategy outlined here can be easily extended to other protein modules, known to bind linear sequence motifs in a highly directional manner.


Figures

Figure 1.
Figure 1.
Schematic representation of the mode of binding of class I and class II peptides into the conserved groove of SH3 domains (adapted from Mayer 2001 and reproduced with permission of the Company of Biologists ©2001). The consensus sequences of the proline-rich peptides are indicated, using X for any amino acid, whereas P and R indicate semiconserved prolines and arginines.
Figure 2.
Figure 2.
Structural analysis of SH3 complexes to illustrate the strategy proposed. Structures of two representative SH3 domains (ribbon drawing, gray) bound to (A) class I (1abo) (Musacchio et al. 1994) and (B) class II (1cka) (Wu et al. 1995) peptides (Cα trace, red). (Blue) The side chain of the conserved Trp residue in the SH3 domain; (arrows) the distances (Cβ–Cβ atoms) between the peptide termini and Trp. The incorporation of a suitable spectroscopic probe (red sphere), like NT or IF, is expected to perturb the intrinsic fluorescence of the conserved Trp in the SH3 domain, in a way that is strongly dependent on the orientation of the binding peptide on the SH3 surface. For instance, if the probe is incorporated at the N terminus of the ligand peptide, the fluorescence of SH3 is expected to be quenched only by a class I peptide, whereas it should be essentially unaffected if the ligand is a class II peptide. (C) Structure of the P2/Myo3-SH3 complex (Musi et al. 2006), showing relevant interactions of the ligand peptide (stick, red) with the SH3 domain (ribbon drawing, gray). The side chains of key amino acids of Myo3-SH3 are also explicitly shown (stick, yellow), while the conserved Trp39 is shown in blue.
Figure 3.
Figure 3.
Binding of NT analogs of P2 to Myo3-SH3 monitored by Trp-to-NT fluorescence energy transfer. (A) Fluorescence spectra of Myo3-SH3 (175 nM) in the presence of increasing concentrations of P2NT1 (0–120 μM). (B) Plot of the fluorescence intensity of Myo3-SH3 as a function of P2NT1 concentration (•). As a control, the data relative to free NT (○) are also reported. Protein samples were excited at 295 nm, and fluorescence data was corrected for IFE according to Equation 1 (see Materials and Methods). (C) Superposition of the fluorescence spectrum of Myo3-SH3 (continuous line), obtained after excitation of the sample at 295 nm, with the absorption spectrum of P2NT1 at pH 2 (dotted line) and pH 8 (dashed line). (D) Determination of Kd values of the Myo3-SH3 complexes with NT analogs: P2NT1 (•-•), P2NT10 (▴-▴), and P2NT13 (○-○). Corrected fluorescence intensities were expressed as F 0 − F, where F 0 is the intensity of Myo3-SH3 in the absence of ligand, and the data points fitted by Equation 2 (continuous lines) to yield K d and ΔF max (see Materials and Methods). All measurements were carried out at 25° ± 0.2°C by exciting the protein samples at 295 nm in 5 mM Tris-HCl buffer (pH 8.0) containing 0.1% (w/v) PEG 8000 and 0.2 M NaCl.
Figure 4.
Figure 4.
Binding of IF analogs of P2 to Myo3-SH3 monitored by collisional quenching of Myo3-SH3 fluorescence. (A) Fluorescence spectra of Myo3-SH3 (175 nM) in the presence of increasing concentrations of P2IF1 (0–120 μM). (B) Change in the fluorescence intensity of Myo3-SH3 as a function of P2IF1 concentration (•). As a control, the effect of free IF is also reported (○). (C) Plot of the fluorescence intensity of Myo3-SH3 as a function of P2IF13 concentration (▴). (Inset) Fluorescence spectra of Myo3-SH3 (175 nM) in the presence of increasing concentrations of P2IF13. (D) Determination of Kd values of SH3 complexes with IF analogs: P2IF1 (•-•) and P2IF13 (▴-▴). For comparison, the binding data of the unmodified P2 peptide to Myo3-SH3 are also included (▵-▵). All spectra were recorded at 25° ± 0.2°C by exciting the protein samples at 295 nm in 5 mM Tris-HCl buffer (pH 8.0) containing 0.1% (w/v) PEG 8000 and 0.2 M NaCl. Continuous lines represent the best fit of the data points to Equation 2.
Figure 5.
Figure 5.
Binding of NT analogs of P2 to Myo3-SH3 monitored by circular dichroism. CD spectra of free Myo3-SH3 (65 μM, ---) and P2NT1 (168 μM, —) were recorded in 5 mM Tris-HCl buffer (pH 8.0) containing 0.1% (w/v) PEG 8000, 0.2 M NaCl. Myo3-SH3 and P2NT1 were alternatively mixed in the same molar ratio (65 μM:168 μM) to yield ∼85% of bound SH3 (Mix_P2NT1, —). (Inset) Difference spectra (Diff_P2NT1 and Diff_P2NT13) obtained by subtracting the theoretical sum spectra of free SH3 and NT peptides from the corresponding spectra of the experimental complexes (Mix_P2NT1 and Mix_P2NT13). Measurements were carried out at 25° ± 0.2°C in a 0.5-cm quartz cuvette and subtracted for the corresponding baseline. Ellipticity data, θ, were expressed in millidegrees (mdeg), without further normalization.

References

    1. Anderson B.L., Boldogh, I., Evangelista, M., Boone, C., Greene, L.A., and Pon, L.A. 1998. The Src homology domain 3 (SH3) of a yeast type I myosin, Myo5p, binds to verprolin and is required for targeting to sites of actin polarization. J. Cell Biol. 141: 1357–1370. - PMC - PubMed
    1. Barlos K., Chatzi, O., Gatos, D., and Stavropoulos, G. 1991. 2-Chlorotrityl chloride resin. Studies on anchoring of Fmoc-amino acids and peptide cleavage. Int. J. Pept. Protein Res. 37: 513–520. - PubMed
    1. Berlman I.B. 1973. Empirical study of heavy-atom collisional quenching of the fluorescence state of aromatic compounds in solution. J. Phys. Chem. 77: 562–567.
    1. Carpino L.A. 1993. 1-Hydroxy-7-azabenzotriazole. An efficient peptide coupling additive. J. Am. Chem. Soc. 115: 4397–4398.
    1. Cesareni G., Panni, S., Nardelli, G., and Castagnoli, L. 2002. Can we infer peptide recognition specificity mediated by SH3 domains? FEBS Lett. 513: 38–44. - PubMed

Publication types

LinkOut - more resources