. 2007 Jun 13;27(24):6461-72.
doi: 10.1523/JNEUROSCI.5239-06.2007.

Adaptation reduces spike-count reliability, but not spike-timing precision, of auditory nerve responses

Affiliations

Adaptation reduces spike-count reliability, but not spike-timing precision, of auditory nerve responses

Michael Avissar et al. J Neurosci. .

Abstract

Sensory systems use adaptive coding mechanisms to filter redundant information from the environment to efficiently represent the external world. One such mechanism found in most sensory neurons is rate adaptation, defined as a reduction in firing rate in response to a constant stimulus. In auditory nerve, this form of adaptation is likely mediated by exhaustion of release-ready synaptic vesicles in the cochlear hair cell. To better understand how specific synaptic mechanisms limit neural coding strategies, we examined the trial-to-trial variability of auditory nerve responses during short-term rate-adaptation by measuring spike-timing precision and spike-count reliability. After adaptation, precision remained unchanged, whereas for all but the lowest-frequency fibers, reliability decreased. Modeling statistical properties of the hair cell-afferent fiber synapse suggested that the ability of one or a few vesicles to elicit an action potential reduces the inherent response variability expected from quantal neurotransmitter release, and thereby confers the observed count reliability at sound onset. However, with adaptation, depletion of the readily releasable pool of vesicles diminishes quantal content and antagonizes the postsynaptic enhancement of reliability. These findings imply that during the course of short-term adaptation, coding strategies that employ a rate code are constrained by increased neural noise because of vesicle depletion, whereas those that employ a temporal code are not.


Figures

Figure 1.
Figure 1.
Examples of cochlear nerve responses to pure tones. A, Raster plot of the response of a single unit to multiple presentations of a pure tone at CF. The small dark ticks represent occurrences of spikes. The solid wavy line represents the pressure waveform of the pure tone stimulus at the tympanic membrane. The large black circles are the boundaries of the first event in the response (see Materials and Methods). The number at the top left of each panel is the CF and stimulus frequency. B–D, Same as A but for cells with progressively higher CFs.
Figure 2.
Figure 2.
Temporal jitter in four cells during adaptation. A, Same raster plot as in Figure 1A. Large filled red circles are the temporal jitter of an event with a duration of one stimulus cycle period centered around the symbol. Error bars are SDs of the temporal jitter estimates as determined by a bootstrap procedure (see Materials and Methods). B–D, Same as in A but for the same cells as in Figure 1B–D. Large open red circles are events whose temporal jitter does not vary significantly from the temporal jitter generated by an unsynchronized response as tested by a Monte Carlo simulation (see Materials and Methods).
Figure 3.
Figure 3.
Spike-timing precision improves with higher CF. The mean temporal jitter of all events is plotted for each cell as a function of CF (circles). Error bars are the average SD of the temporal jitter estimate as determined by a bootstrap procedure (see Materials and Methods). Red circles represent units for which >5% of events had temporal jitters that could have been generated by an unsynchronized event with 5% probability, as tested by a Monte Carlo simulation (see Materials and Methods). Open squares represent averaged data for four logarithmically spaced frequency ranges. Error bars are the SEs of the mean. The solid curved line is the temporal jitter expected for an unsynchronized event resulting from using an analysis window that is one stimulus cycle long. It is equal to the square root of 1/12 divided by the CF (for derivation, see Materials and Methods).
Figure 4.
Figure 4.
Temporal jitter is unaffected by short-term adaptation at all CFs studied. The mean temporal jitter for the first (filled circles) and last (open circles) 10 ms of the response of each unit is plotted against the CF. Error bars for single units are left out for the sake of clarity and are on the same order as those for Figure 3. Red circles represent 10 ms windows for which >5% of events had temporal jitters that could have been produced by an unsynchronized event with 5% probability as tested by a Monte Carlo simulation (see Materials and Methods). Square symbols are averaged data for four frequency ranges (same ranges as Fig. 3). The solid curved line is the temporal jitter expected for an unsynchronized event resulting from using an analysis window that is one stimulus cycle long. It is equal to the square root of 1/12 divided by the CF (for derivation, see Materials and Methods).
Figure 5.
Figure 5.
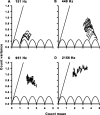
Variance and mean of the spike count for four cells. A, The spike-count variance plotted as a function of the spike-count mean for the same cell as in Figure 1A. Each dot represents the variance and mean for one 10 ms window of the response as the window slides in 10 μs steps across the whole response window. The solid scalloped line is the minimum variance possible for a given spike-count mean. The solid straight line is the unity line and represents the variance expected for a Poisson process at each mean. The number at the top left of the panel is the CF and stimulus frequency. B–D, Same as in A, but for the same cells as in Figure 1B–D.
Figure 6.
Figure 6.
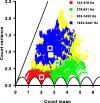
All cells have sub-Poisson spike-count variance. The spike-count variance is plotted against the spike-count mean for all 10 ms windows of all 85 cells studied (colored symbols). Each color represents a different frequency range (top right key). The solid scalloped line is the minimum variance possible for a given spike-count mean. The solid straight line is the unity line and represents the variance expected for a Poisson process at each mean. Square symbols are plotted at the mean of the count mean and count variance for each frequency range.
Figure 7.
Figure 7.
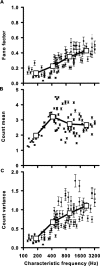
Spike-count reliability decreases with higher CF. A, The mean Fano factor (spike-count variance/mean) for each unit plotted against CF. Filled circles are the average FF for all 10 ms windows in the cell's response. The single gray circle is a unit for which >5% of the 10 ms windows had measured FF values that did not vary significantly from an FF generated by a Poisson process with the same instantaneous firing rate function. This was tested using a Monte Carlo simulation (see Materials and Methods). B, Spike-count mean as a function of CF. C, Spike-count variance as a function of CF. Error bars represent the average SD of the count mean, variance, and FF for all 10 ms windows in the cell's response as determined by a bootstrap procedure (see Materials and Methods). Large open squares represent the data binned into four frequency ranges and averaged (same ranges as Fig. 6). The SEM is smaller than the square symbol size in all cases.
Figure 8.
Figure 8.
FF increases during short-term adaptation. The Fano factor (black), spike-count mean (blue), and spike-count variance (red) plotted as a function of duration of stimulation for the same cell as in Figure 1D. The thickness of each curve is the SD of the estimated parameter at each time as determined by a bootstrap procedure (see Materials and Methods). The number at the top left of the figure is the CF and stimulus frequency.
Figure 9.
Figure 9.
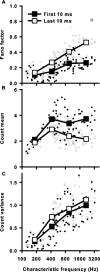
Spike-count reliability decreases during short-term adaptation for all but the lowest frequency cells. A, Fano factor for the first (filled circles) and last (open circles) 10 ms window of a single cell's response as a function of CF. Error bars for single units are left out for the sake of clarity and are on the same order as those for Figure 7. The single open gray circle represents a cell with an adapted FF value that did not vary significantly from the FF generated by a Poisson process with the same instantaneous firing rate function as tested by a Monte Carlo simulation (see Materials and Methods). Large square symbols are averages for four frequency ranges (same ranges as in Fig. 6). All SEs are smaller than the symbol size. B, Spike-count mean of the first and last 10 ms as a function of CF. C, Spike-count variance of the first and last 10 ms as a function of CF.
Figure 10.
Figure 10.
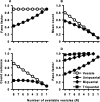
Vesicle depletion reduces spike-count reliability. Vesicle- and spike-count statistics were predicted from a model. Transmitter release was modeled as a binomial process with N available vesicles, each with release probability, pvesicle = 0.1. Spike generation required ≥1 (uniquantal), ≥2 (biquantal), or ≥3 (triquantal) released vesicles. Parameters in all panels are plotted as a function of adaptation, simulated by a decrease in N. A, Fano factor of vesicle and spike count for the uniquantal case. B, Mean vesicle and spike count for the uniquantal case. C, Vesicle- and spike-count variance for the uniquantal case. D, Fano factor of spike count for the uniquantal, biquantal, and triquantal cases.

Similar articles

Cited by

References

    1. Adrian ED, Zotterman Y. The impulses produced by sensory nerve endings: II. The response of a single end organ. J Physiol (Lond) 1926;61:151–171. - PMC - PubMed
    1. Anderson DJ, Rose JE, Hind JE, Brugge JF. Temporal position of discharges in single auditory nerve fibers within the cycle of a sine-wave stimulus: frequency and intensity effects. J Acoust Soc Am. 1971;49:1131–1139. - PubMed
    1. Barlow HB. Possible principles underlying the transformations of sensory messages. In: Rosenblith WA, editor. Sensory communication. Cambridge, MA: MIT; 1961. pp. 217–234.
    1. Berry MJ, Warland DK, Meister M. The structure and precision of retinal spike trains. Proc Natl Acad Sci USA. 1997;94:5411–5416. - PMC - PubMed
    1. Berry MJ, II, Meister M. Refractoriness and neural precision. J Neurosci. 1998;18:2200–2211. - PMC - PubMed

Publication types