. 2007 Jun 13;27(24):6489-99.
doi: 10.1523/JNEUROSCI.0016-07.2007.

Effect of behavioral context on representation of a spatial cue in core auditory cortex of awake macaques

Affiliations

Effect of behavioral context on representation of a spatial cue in core auditory cortex of awake macaques

Brian H Scott et al. J Neurosci. .

Abstract

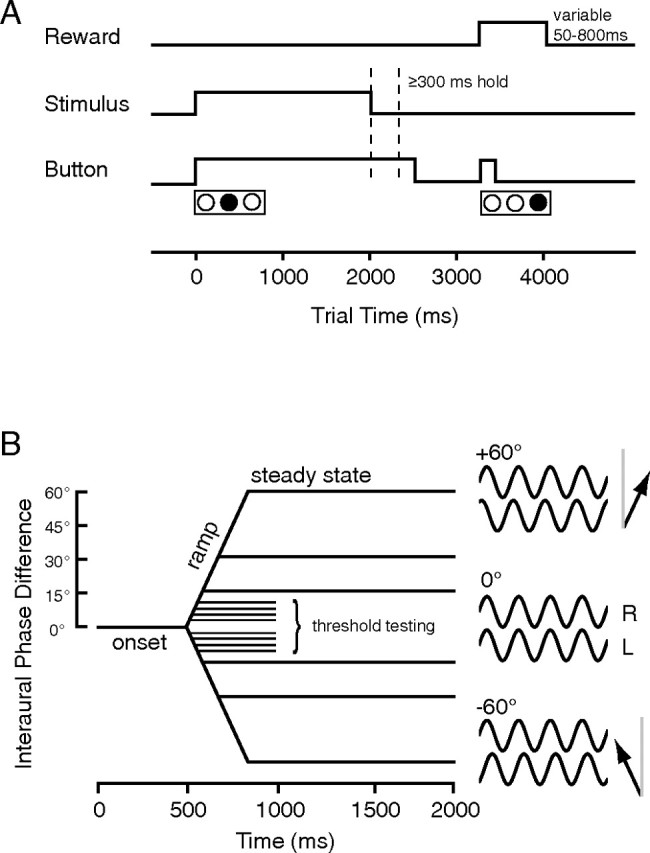
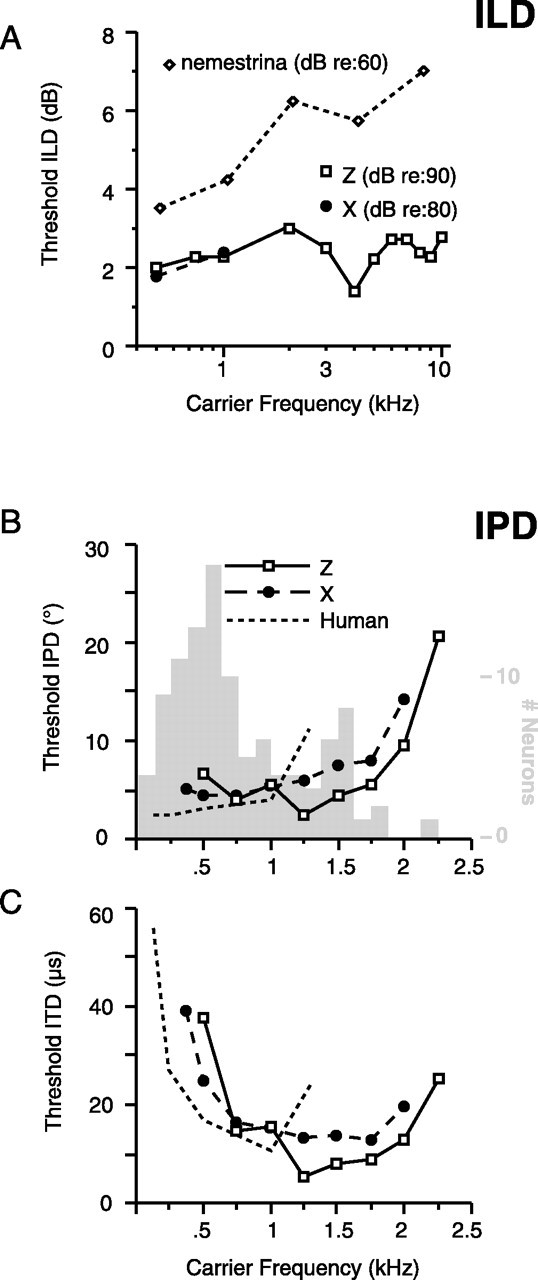
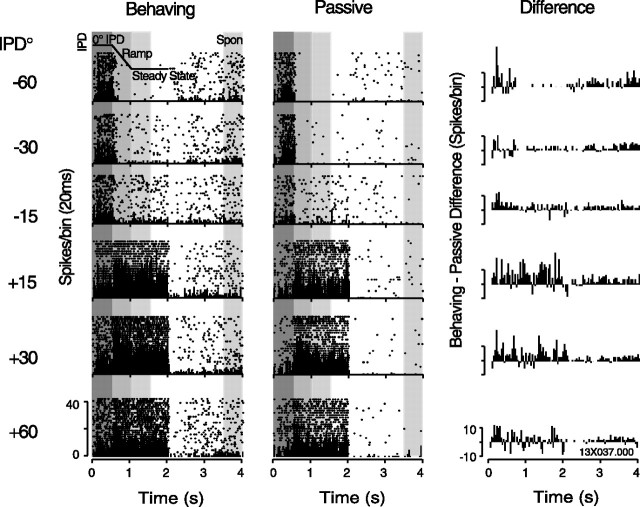
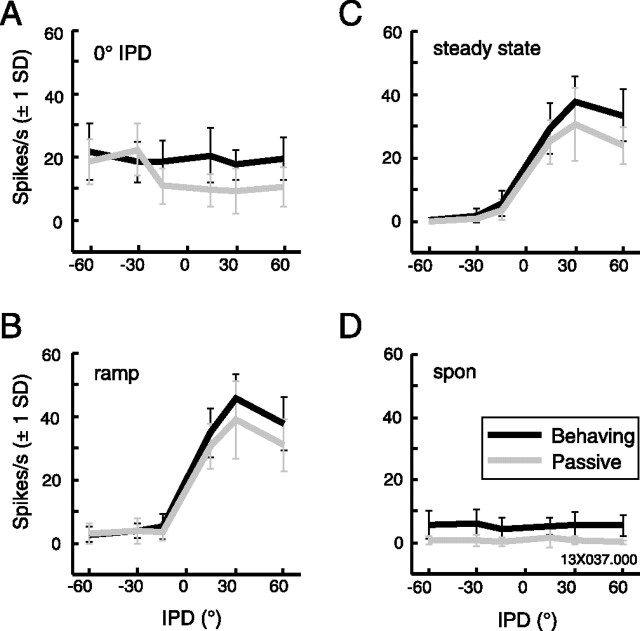
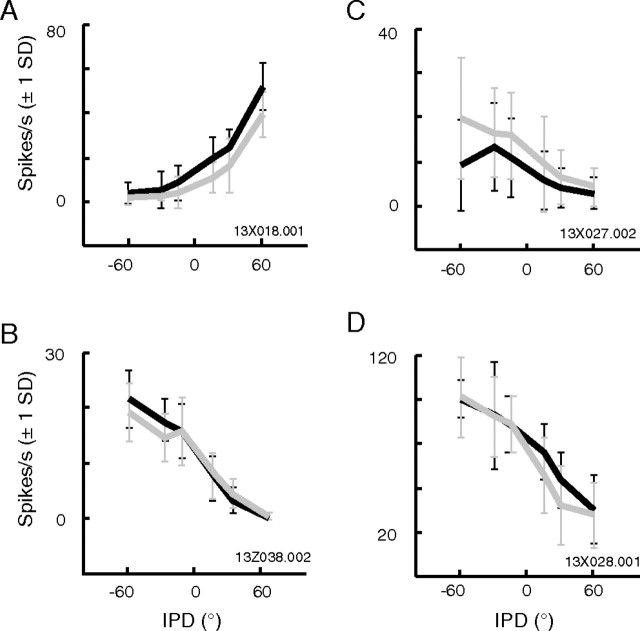
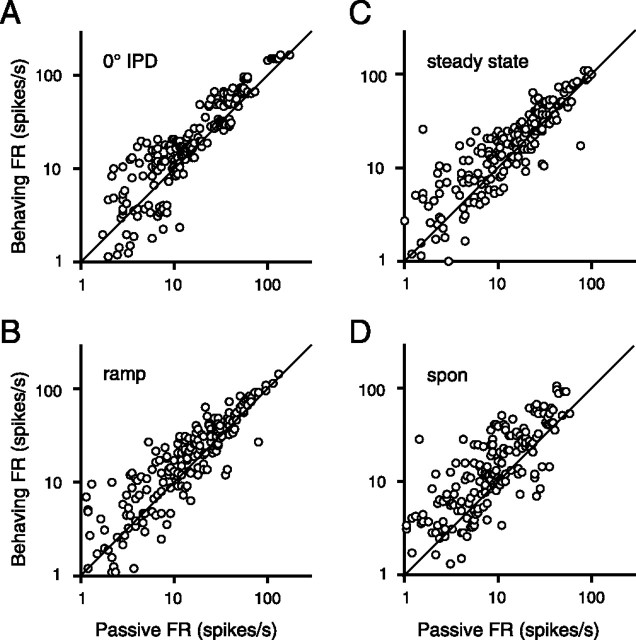
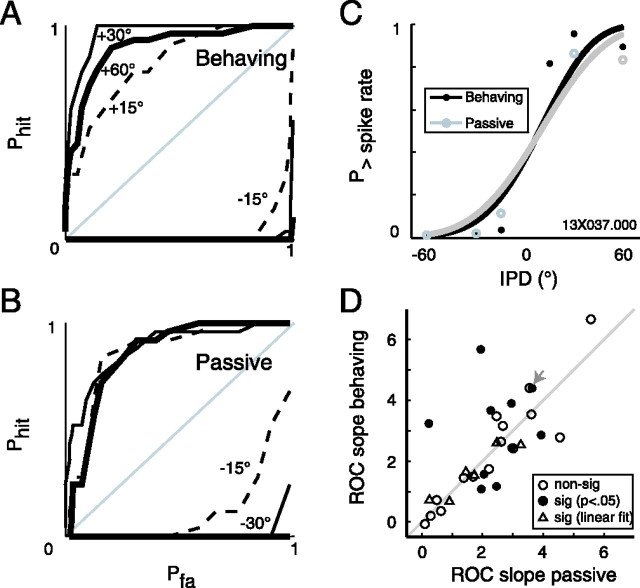
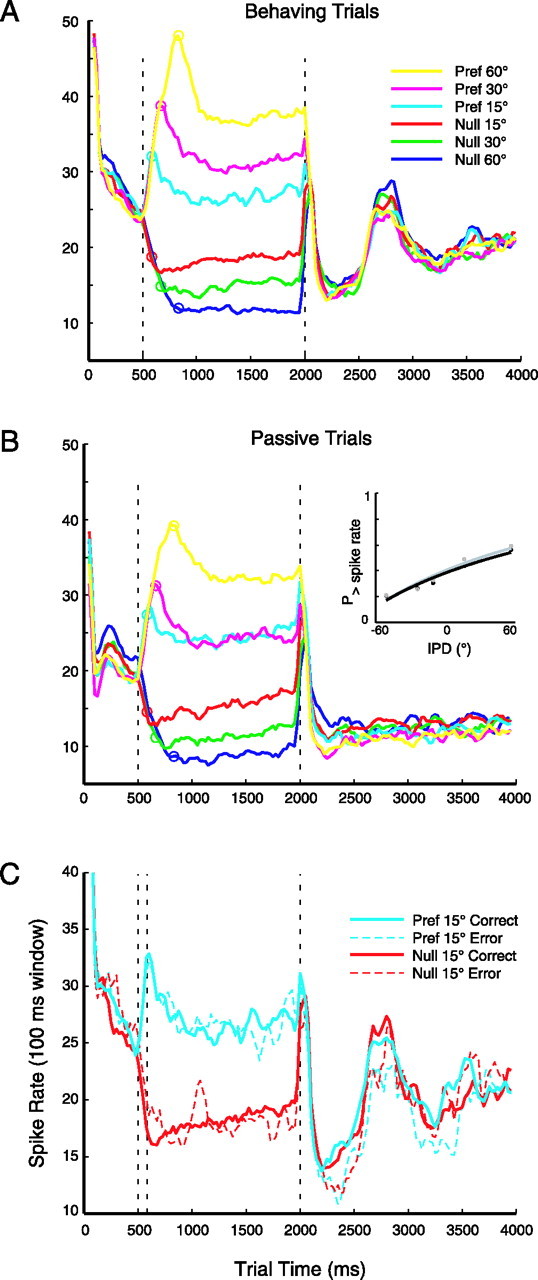
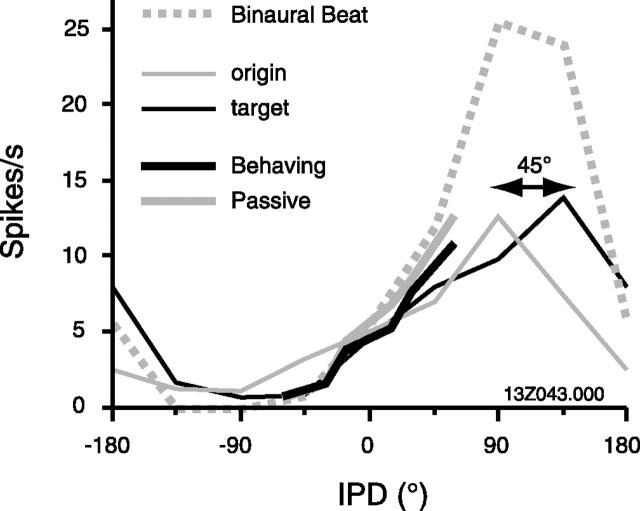
Primary auditory cortex plays a crucial role in spatially directed behavior, but little is known about the effect of behavioral state on the neural representation of spatial cues. Macaques were trained to discriminate binaural cues to sound localization, eventually allowing measurement of thresholds comparable to human hearing. During behavior and passive listening, single units in low-frequency auditory cortex showed robust and consistent tuning to interaural phase difference (IPD). In most neurons, behavior exerted an effect on peak discharge rate (58% increased, 13% decreased), but this was not accompanied by a detectable shift in the best IPD of any cell. Neurometric analysis revealed a difference in discriminability between the behaving and passive condition in half of the sample (52%), but steepening of the neurometric function (29%) was only slightly more common than flattening (23%). This suggests that performance of a discrimination task does not necessarily confer an advantage in understanding the representation of the spatial cue in primary auditory cortex but nevertheless revealed some physiological effects. These results suggest that responses observed during passive listening provide a valid representation of neuronal response properties in core auditory cortex.


Figures

Figure 1.
Figure 1.
Macaques discriminated the direction of IPD shifts away from midline. A, The animal initiated a behaving trial by pressing and holding the center of three buttons (bottom trace). The button was held through the duration of the sound (middle trace) plus a 300 ms hold time, after which he could release the center button and press the right or left button to indicate the direction of IPD shift. Correct responses earned a liquid reward of varying size (top trace; see Materials and Methods). B, Pure-tone dynamic IPD stimuli originated at 0° IPD (0–500 ms), then linearly ramped to a second steady-state IPD [≤60° phase lead at left (L) or right (R) ear]. A restricted range (±15°) near the midline was used for threshold determination, and a wider range (±60°) and longer steady state were used during physiological behaving/passive comparisons. Arrows on the right depict the apparent direction of origin on the horizon (25° relative to gray midline) of a 1000 Hz tone leading in phase by 60° at the right ear (top icon) or left ear (bottom icon).
Figure 2.
Figure 2.
Psychophysical discrimination thresholds for binaural spatial cues. A, ILD thresholds across carrier frequency. Open squares, monkey Z; filled circles, monkey X; open diamonds, Macaca nemestrina (Houben and Gourevitch, 1979). Base SPL was 90 or 80 dB (monkey Z and X, respectively). B, Thresholds for IPD discrimination across carrier frequency in both monkeys; the dashed line traces comparable thresholds determined in humans by Klump and Eady (1965). The gray histogram shows distribution of best frequencies for all IPD-sensitive neurons (as determined by binaural beats, n = 268) on the same frequency axis. Thresholds are higher for carriers >1.5 kHz, the frequency range in which fewer neurons are sensitive to IPD. C, Same thresholds replotted as ITDs (in microseconds).
Figure 3.
Figure 3.
A single-unit response to dynamic IPD under behaving and passive conditions shows consistent sensitivity to IPD and a higher discharge rate during behavior. Peristimulus time histograms (20 ms bins) are overlaid on raster plots of spike times on individual trials. Behaving (left) and passive (middle) data are arrayed from negative/ipsilateral phase shifts (top) to positive/contralateral phase shifts (bottom). Right panels plot the difference in histogram bin values (behaving–passive); positive bins indicate more spikes during behavior. The icon overlaid in the top left panel (−60°, behaving) shows the time course of the stimulus >0–2 s. Vertical gray regions mark the four 500 ms epochs of the response over which firing rates were measured: 0° IPD onset, dynamic IPD ramp, steady state, and a measure of spontaneous (Spon) rate at the end of the trial.
Figure 4.
Figure 4.
Firing rate tuning to IPD was similar under behaving and passive conditions (same neuron as depicted in Fig. 3). Mean firing rates (error bars indicate ±1 SD) during the four stimulus epochs defined in Figure 3, under behaving (black) and passive (gray) conditions. A, 0° IPD onset. B, Dynamic IPD ramp. C, Steady-state IPD. D, Spontaneous (spon) rate.
Figure 5.
Figure 5.
A–D, Examples of tuning to IPD during the steady state in four neurons, under behaving (black) and passive (gray) conditions. Error bars indicate ±1 SD.
Figure 6.
Figure 6.
Comparison of firing rates (FR) under behaving and passive conditions for the full population of equivalent stimuli (each cell contributes multiple points). Points above the line of unity indicate an elevated firing rate during behavior. All four epochs show a significant shift by a paired t test (p < 0.0001). A, 0° IPD onset. B, Dynamic IPD ramp. C, Steady-state IPD. D, Spontaneous (spon) rate.
Figure 7.
Figure 7.
ROC analysis reveals comparable neural tuning to IPD between behavioral conditions. A–C, ROC curves at each IPD value under behaving (A) and passive (B) conditions are integrated to generate the sigmoid neurometric functions in C (same neuron as depicted in Figs. 3 and 4). Curves in C are fit with two-parameter Weibull distributions; the difference in slope between behaving (black curve) and passive (gray curve) conditions was significant by a bootstrap simulation. D, Function slopes are compared between conditions (overall difference for the population: p = 0.77, Wilcoxon sign-rank). Filled circles, differences in slope significant (p < 0.05) by bootstrap simulation; open circles, p ≥ 0.05; open triangles, difference is significant by a linear fit only. The gray arrow marks the neuron from C. non-sig, Nonsignificant; sig, significant.
Figure 8.
Figure 8.
Average discharge rate for the population tracked IPD through the trial but did not reliably predict errors in behavioral response. A, Discharge rate in a 100 ms sliding window (in 25 ms steps), for trials under the behaving condition, sorted by magnitude and direction of IPD shift from blue (60° in the null direction) to yellow (60° in the preferred direction). The hemifield contralateral to the recording site was preferred in 22 of 31 neurons. The dashed line at 500 ms marks the beginning of the dynamic IPD ramp, open circles mark the end of the ramp and the beginning of the steady-state IPD, and the dashed line at 2000 ms marks the offset of the stimulus. B, Trials during passive stimulation (stimuli presented in blocks), same conventions as in A. Inset, Neurometric functions for the pooled population data, with statistically identical slopes between the behaving (black) and passive (gray) conditions (axes as in Fig. 7C). C, Discharge rate during behavior on ±15° trials, separated into correct (solid lines) and error (dashed lines) responses. From left to right, vertical dashed lines represent the beginning and end of the IPD ramp and the offset of the stimulus. n = 1245 correct and 528 error trials, in 31 neurons. Pref, Preferred.
Figure 9.
Figure 9.
Behavior effects on tuning curves are small, relative to tuning shifts induced by stimulus context. Tuning to IPD during passive listening is influenced by the preceding stimulus, in this case a positive (origin, thin gray line) or negative (target, thin black line) 90° phase shift (Malone et al., 2002). The computed phase shift between these functions is 45°. Thick black and gray lines indicate steady-state responses under behaving and passive conditions, respectively. The thick dashed gray line indicates spike rate in response to a binaural beat [500 ms cycle, divided into 62.5 ms bins centered at the same 8 IPD values used by Malone et al. (2002)].

Similar articles

Cited by

References

    1. Bakin JS, Weinberger NM. Classical conditioning induces CS-specific receptive field plasticity in the auditory cortex of the guinea pig. Brain Res. 1990;536:271–286. - PubMed
    1. Beitel RE, Schreiner CE, Cheung SW, Wang X, Merzenich MM. Reward-dependent plasticity in the primary auditory cortex of adult monkeys trained to discriminate temporally modulated signals. Proc Natl Acad Sci USA. 2003;100:11070–11075. - PMC - PubMed
    1. Benson DA, Hienz RD. Single-unit activity in the auditory cortex of monkeys selectively attending left vs. right ear stimuli. Brain Res. 1978;159:307–320. - PubMed
    1. Benson DA, Hienz RD, Goldstein MH., Jr Single-unit activity in the auditory cortex of monkeys actively localizing sound sources: spatial tuning and behavioral dependency. Brain Res. 1981;219:249–267. - PubMed
    1. Britten KH, Newsome WT, Shadlen MN, Celebrini S, Movshon JA. A relationship between behavioral choice and the visual responses of neurons in macaque MT. Vis Neurosci. 1996;13:87–100. - PubMed

Publication types

LinkOut - more resources