. 2007 Jun 13:8:199.
doi: 10.1186/1471-2105-8-199.

A domain-based approach to predict protein-protein interactions

Affiliations

A domain-based approach to predict protein-protein interactions

Mudita Singhal et al. BMC Bioinformatics. .

Abstract

Background: Knowing which proteins exist in a certain organism or cell type and how these proteins interact with each other are necessary for the understanding of biological processes at the whole cell level. The determination of the protein-protein interaction (PPI) networks has been the subject of extensive research. Despite the development of reasonably successful methods, serious technical difficulties still exist. In this paper we present DomainGA, a quantitative computational approach that uses the information about the domain-domain interactions to predict the interactions between proteins.

Results: DomainGA is a multi-parameter optimization method in which the available PPI information is used to derive a quantitative scoring scheme for the domain-domain pairs. Obtained domain interaction scores are then used to predict whether a pair of proteins interacts. Using the yeast PPI data and a series of tests, we show the robustness and insensitivity of the DomainGA method to the selection of the parameter sets, score ranges, and detection rules. Our DomainGA method achieves very high explanation ratios for the positive and negative PPIs in yeast. Based on our cross-verification tests on human PPIs, comparison of the optimized scores with the structurally observed domain interactions obtained from the iPFAM database, and sensitivity and specificity analysis; we conclude that our DomainGA method shows great promise to be applicable across multiple organisms.

Conclusion: We envision the DomainGA as a first step of a multiple tier approach to constructing organism specific PPIs. As it is based on fundamental structural information, the DomainGA approach can be used to create potential PPIs and the accuracy of the constructed interaction template can be further improved using complementary methods. Explanation ratios obtained in the reported test case studies clearly show that the false prediction rates of the template networks constructed using the DomainGA scores are reasonably low, and the erroneous predictions can be filtered further using supplementary approaches such as those based on literature search or other prediction methods.


Figures
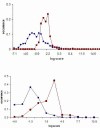
Figure 1
Figure 1
Comparison of the strengths of the Munich Information Center for Protein Sequences (MIPS) positive (red line with squares) and negative (blue line with circles) protein-protein interactions computed using the InterDom domain-domain interaction scores. The interactions with a score of zero are not reported. The histogram curves were calculated by binning the logarithm of the protein-protein interaction scores that were computed using the maximum-score detection rule. Vertical axis shows the percentage of the PPIs with interaction scores that are within the strength interval of a particular bin. Top: Yeast PPI; Bottom: Human PPI.
Figure 2
Figure 2
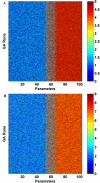
Comparison of the scores of the common 103 parameters that were optimized using different ranges for the scores with the inclusive set. Employed range was: (A) [0–5] and (B) [0–9]. In the figures, the vertical axis represents a particular GA run and the horizontal axis shows the optimization parameters, which are rank ordered according to their mean strength values. Each column shows the score of a particular parameter obtained in different GA runs. A consistent color through a column indicates that the optimized value of corresponding parameter is almost the same in all the GA runs. Each plot reports the optimized score set values for more than 2,000 GA runs. Intense blue and red colors respectively represent the non-interacting and interacting domain-domain pairs. The Yeast MIPS dataset compiled by Jansen et al. was used.
Figure 3
Figure 3
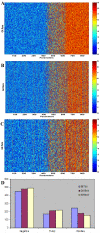
Score comparison between the optimization studies with different number of parameters. Similar to Figure 2, parts (A-C) report the scores of the 867 parameters that were common in all three cases. Inclusive set optimizations with: (A) 867; (B) 2466; and (C) 5095 parameters. Part (D) reports and compares the classification of the optimized scores according to their interaction profiles.
Figure 4
Figure 4
Comparison of the parameter scores optimized using the 344 parameter closed set with maximum (x-axis) and total (y-axis) score detection rules. Reported scores are the averages of the GA runs after the infrequently occurring parameter values are discarded during analysis. Histogram diagram reports the score distribution of the parameters that can be optimized in the simulations. Each (x,y) entry in this histogram plot reports the number of parameters that has mean values of x and y when the maximum- and total-score detection rule was used in the optimization, respectively. The maximum value of the color scale is lowered from 67 to 20 to enhance the contrast between the histogram points. The yeast MIPS dataset compiled by Jansen et al. was used.
Figure 5
Figure 5
Score comparison of the 344 parameters that are common in the closed 344 parameter (x-axis) and inclusive 867 parameter (y-axis) datasets. The maximum score detection rule was used and the reported scores are the averages of the GA runs after the infrequently occurring parameter values are discarded during analysis. Each (x,y) entry in this histogram plot reports the number of parameters that has mean values of x and y when the referred closed and inclusive dataset was used in the optimization, respectively.
Figure 6
Figure 6
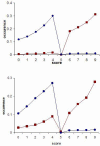
Comparison of the strengths of the MIPS positive (red line with squares) and negative (blue line with circles) protein-protein interactions computed using the DomainGA optimized domain-domain interaction scores. Vertical axis shows the percentage of the PPIs with interaction scores that were calculated by binning the total protein-protein interaction scores using unit bin sizes. Top: Inclusive set yeast PPI; Bottom: Closed set human PPI.
Figure 7
Figure 7
Comparison of the mean scores of the parameters that were optimized using the 344 parameter closed set training data with different fitness functions. X-axis: Optimization using both the negative and positive PPIs with the maximum score detection rule (as in Figure 4). Y-axis: Optimization with the minimum parameter magnitude fitness function using only the positive PPI list. The maximum value of the color scale is lowered from 121 to 30 to enhance the contrast between the histogram points.

Similar articles

Cited by

References

    1. Uetz P, Giot L, Cagney G, Mansfield TA, Judson RS, Knight JR, Lockshon D, Narayan V, Srinivasan M, Pochart P, et al. A comprehensive analysis of protein-protein interactions in Saccharomyces cerevisiae. Nature. 2000;403:623–627. doi: 10.1038/35001009. - DOI - PubMed
    1. Legrain P, Wojcik J, Gauthier JM. Protein–protein interaction maps: a lead towards cellular functions. Trends Genet. 2001;17:346–352. doi: 10.1016/S0168-9525(01)02323-X. - DOI - PubMed
    1. Kumar A, Snyder M. Protein complexes take the bait. Nature. 2002;415:123–124. doi: 10.1038/415123a. - DOI - PubMed
    1. Bader JS. Greedily building protein networks with confidence. Bioinformatics. 2003;19:1869–1874. doi: 10.1093/bioinformatics/btg358. - DOI - PubMed
    1. Rhodes DR, Tomlins SA, Varambally S, Mahavisno V, Barrette T, Kalyana-Sundaram S, Ghosh D, Pandey A, Chinnaiyan AM. Probabilistic model of the human protein-protein interaction network. Nat Biotechnol. 2005;23:951–959. doi: 10.1038/nbt1103. - DOI - PubMed

Publication types