. 2007 Jun 13:7:15.
doi: 10.1186/1472-6947-7-15.

Automated real time constant-specificity surveillance for disease outbreaks

Affiliations

Automated real time constant-specificity surveillance for disease outbreaks

Shannon C Wieland et al. BMC Med Inform Decis Mak. .

Abstract

Background: For real time surveillance, detection of abnormal disease patterns is based on a difference between patterns observed, and those predicted by models of historical data. The usefulness of outbreak detection strategies depends on their specificity; the false alarm rate affects the interpretation of alarms.

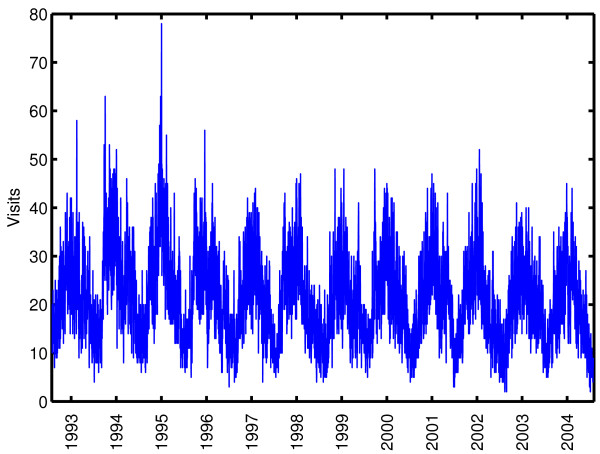
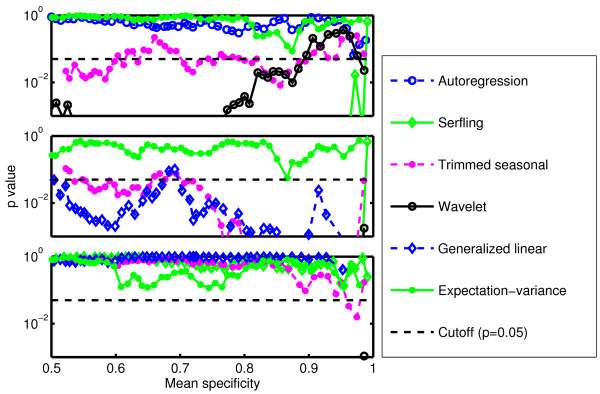
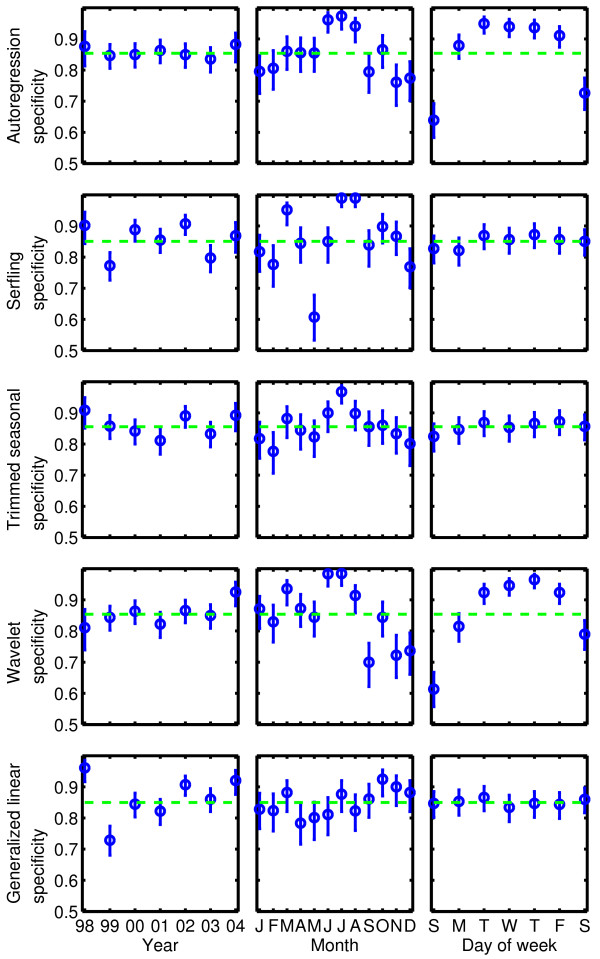
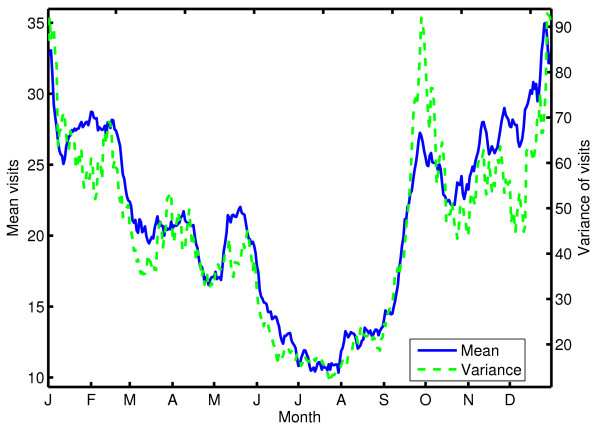
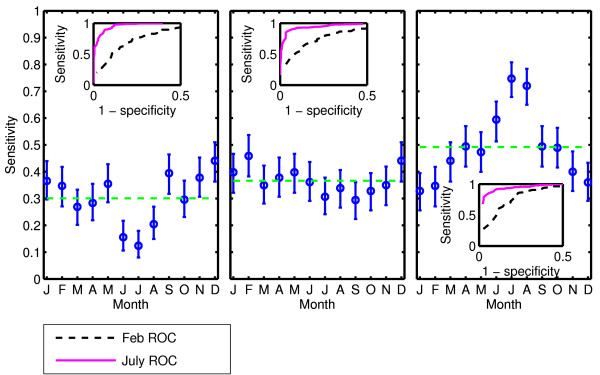
Results: We evaluate the specificity of five traditional models: autoregressive, Serfling, trimmed seasonal, wavelet-based, and generalized linear. We apply each to 12 years of emergency department visits for respiratory infection syndromes at a pediatric hospital, finding that the specificity of the five models was almost always a non-constant function of the day of the week, month, and year of the study (p < 0.05). We develop an outbreak detection method, called the expectation-variance model, based on generalized additive modeling to achieve a constant specificity by accounting for not only the expected number of visits, but also the variance of the number of visits. The expectation-variance model achieves constant specificity on all three time scales, as well as earlier detection and improved sensitivity compared to traditional methods in most circumstances.

Conclusion: Modeling the variance of visit patterns enables real-time detection with known, constant specificity at all times. With constant specificity, public health practitioners can better interpret the alarms and better evaluate the cost-effectiveness of surveillance systems.


Figures

Figure 1
Figure 1
Emergency department visits for respiratory presenting complaints, August 1, 1992 – July 30, 2004. Daily time series showing the number of patients presenting with respiratory complaints to the emergency department during a 12 year period.
Figure 2
Figure 2
Evaluating variability in specificity on three time scales. Plots of p-values for the chi-square test over various time scales for the five comparison models over a range of mean specificity values from 0.50 to 0.99, as well as p-values for the expectation-variance model. Top: calendar year of study. Middle: month of year. Bottom: day of week. The expectation-variance model has a p-value over 0.05 for the entire range of mean specificity values for all three timescales, so the null hypothesis of constant specificity is not rejected. All plots not shown are highly significant (p < 0.001) for non-constancy.
Figure 3
Figure 3
Average specificity trends over time. Average specificity for each calendar year, month, and day of week for the five comparison methods during the study period. Data shown were recorded for each model implemented at 85% mean specificity. Similar trends were observed for all methods at 97% mean specificity (data not shown).
Figure 5
Figure 5
Seasonal trends in the mean and variance of ED visits. Mean number of ED visits (left axis, solid blue line) and mean variance in ED visits (right axis, dashed green line) as a function of the day of year. Data were smoothed using 5-day and 11-day moving averages, respectively. The ED utilization mean and variance are highest in the winter and lowest during the summer.
Figure 4
Figure 4
Seasonal sensitivity trends. Average sensitivity for each month of the study period for the autoregressive (left), trimmed seasonal (center), and expectation-variance (right) models when applied to data containing a superimposed spike outbreak of 10 additional patients during one day. Data shown were collected at a mean specificity of 97%. The sensitivity of the trimmed seasonal and autoregression models is higher during the winter than during the summer. Sensitivity is higher during the summer than during the winter for the expectation-variance model. July receiver-operator (ROC) curves lie below February ROC curves for all three models (insets). Similar trends were observed for flat and linear outbreaks.

Similar articles

Cited by

References

    1. Yuan CM, Love S, Wilson M. Syndromic surveillance at hospital emergency departments – Southeastern Virginia. MMWR Morb Mortal Wkly Rep. 2004;53:56–58. - PubMed
    1. Hammond L, Papadopoulos S, Johnson C, MaWhinney S, Nelson B, Todd J. Use of an Internet-Based Community Surveillance Network to Predict Seasonal Communicable Disease Morbidity. Pediatrics. 2002;109:414–418. doi: 10.1542/peds.109.3.414. - DOI - PubMed
    1. Mostashari F, Fine A, Das D, Adams J, Layton M. Use of Ambulance Dispatch Data as an Early Warning System for Communitywide Influenzalike Illness, New York City. J Urban Health. 2003;80:i43–i49. - PMC - PubMed
    1. Heffernan R, Mostashari F, Das D, Besculides M, Rodriguez C, Greenko J, Steiner-Sichel L, Balter S, Karpati A, Thomas P, Phillips M, Ackelsberg J, Lee E, Leng J, Hartman J, Metzger K, Rosselli R, Weiss D. New York City Syndromic Surveillance Systems. MMWR Morb Mortal Wkly Rep. 2004;53:23–27. - PubMed
    1. Lewis M, Pavlin J, Mansfield J, O'Brien S, Boomsma L, Elbert Y, Kelley P. Disease outbreak detection system using syndromic data in the greater Washington DC area. Am J Prev Med. 2002;23:180–186. doi: 10.1016/S0749-3797(02)00490-7. - DOI - PubMed

Publication types

LinkOut - more resources