. 2007 Jun 13:7:67.
doi: 10.1186/1471-213X-7-67.

Ovarian gene expression in the absence of FIGLA, an oocyte-specific transcription factor

Affiliations

Ovarian gene expression in the absence of FIGLA, an oocyte-specific transcription factor

Saurabh Joshi et al. BMC Dev Biol. .

Abstract

Background: Ovarian folliculogenesis in mammals is a complex process involving interactions between germ and somatic cells. Carefully orchestrated expression of transcription factors, cell adhesion molecules and growth factors are required for success. We have identified a germ-cell specific, basic helix-loop-helix transcription factor, FIGLA (Factor In the GermLine, Alpha) and demonstrated its involvement in two independent developmental processes: formation of the primordial follicle and coordinate expression of zona pellucida genes.

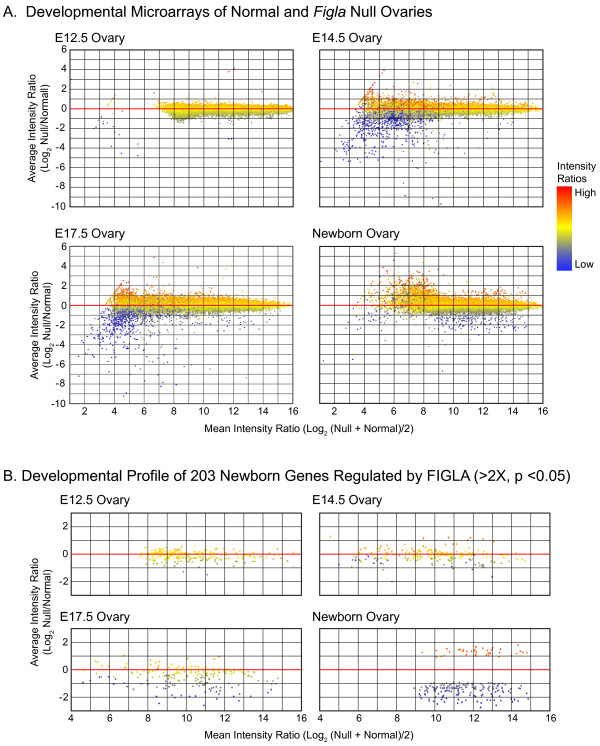
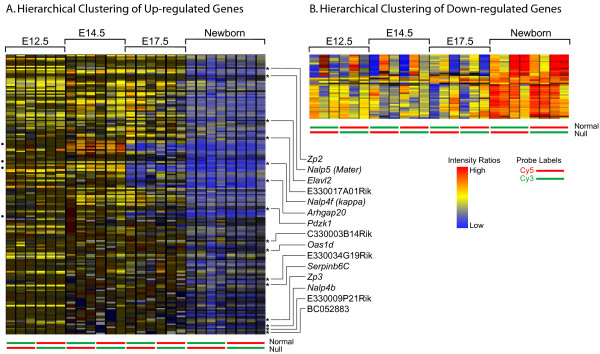
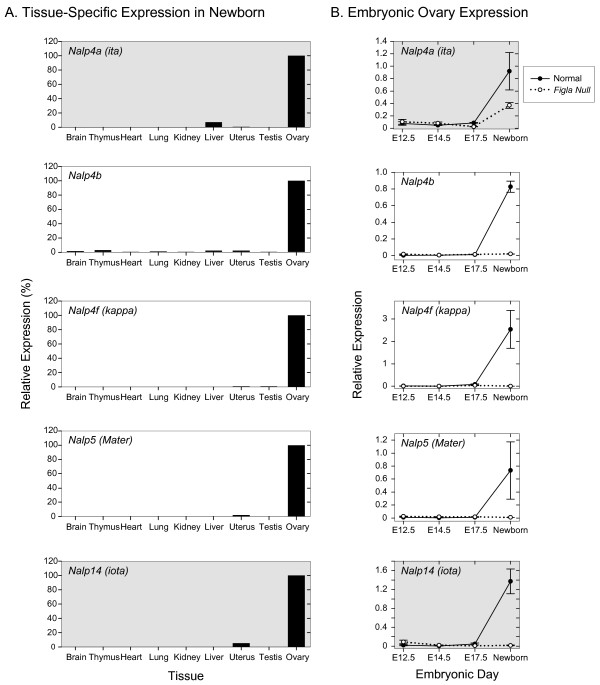
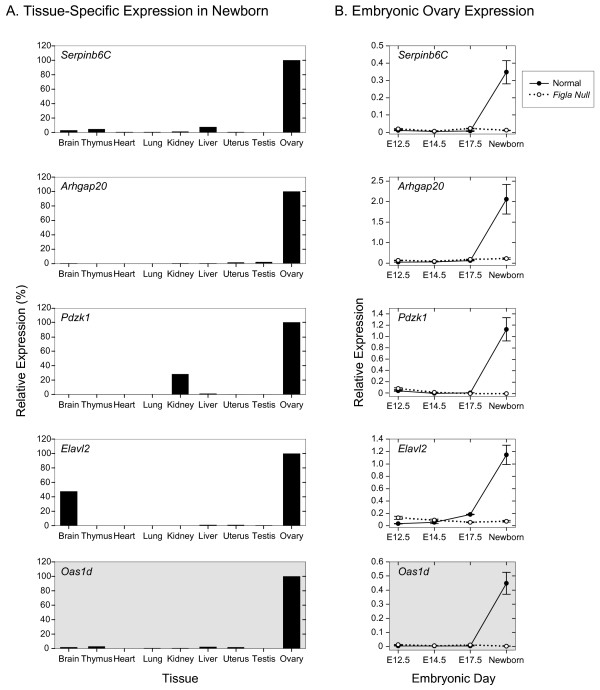
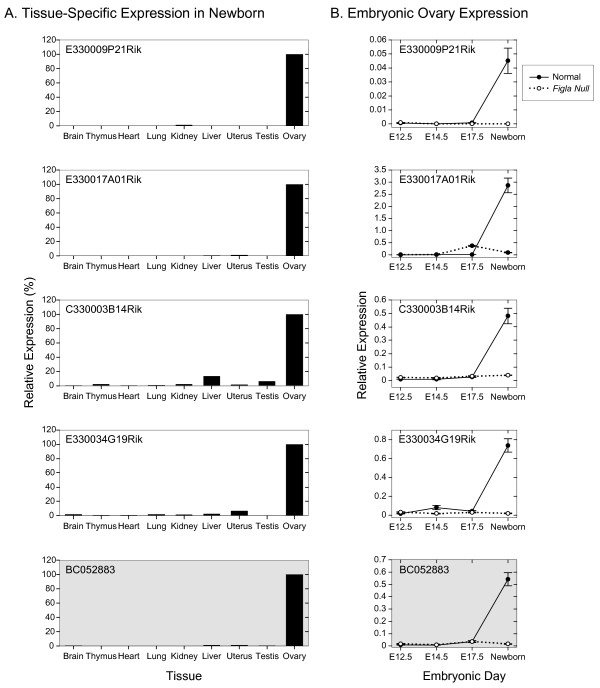
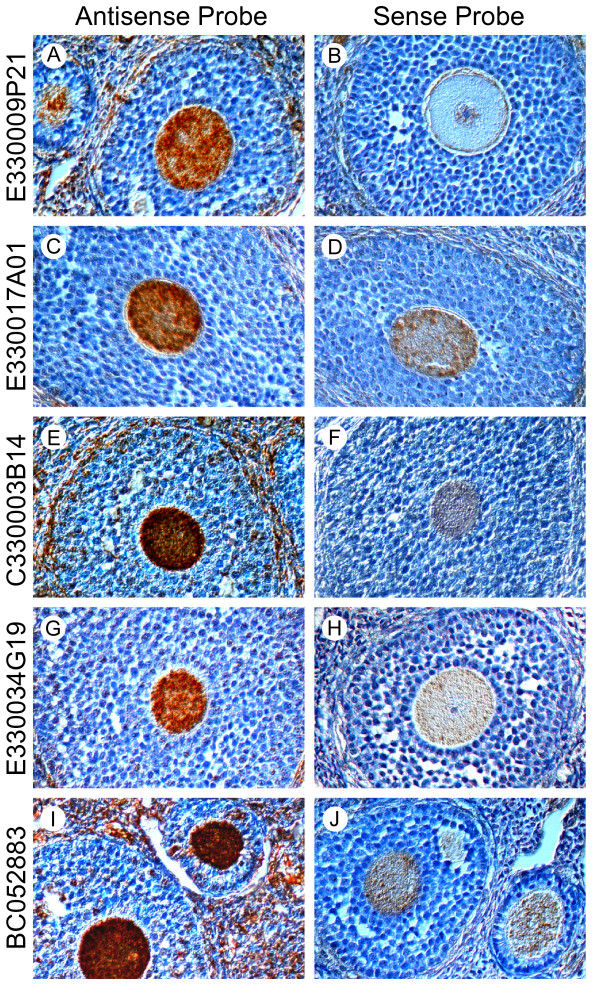
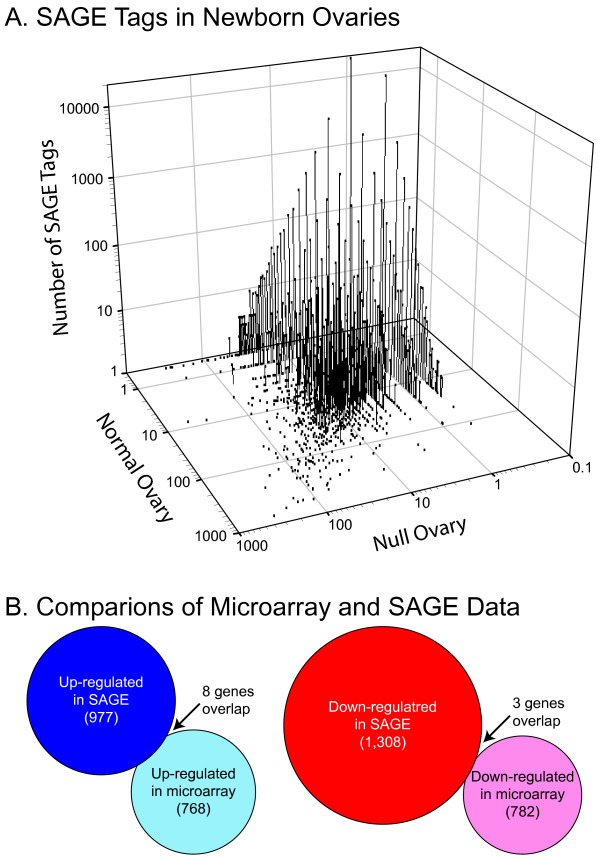
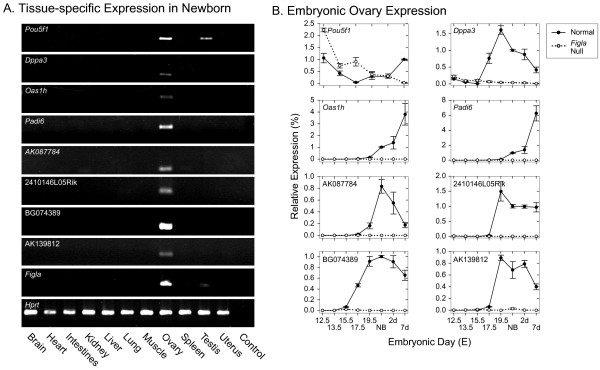
Results: Taking advantage of Figla null mouse lines, we have used a combined approach of microarray and Serial Analysis of Gene Expression (SAGE) to identify potential downstream target genes. Using high stringent cutoffs, we find that FIGLA functions as a key regulatory molecule in coordinating expression of the NALP family of genes, genes of known oocyte-specific expression and a set of functionally un-annotated genes. FIGLA also inhibits expression of male germ cell specific genes that might otherwise disrupt normal oogenesis.

Conclusion: These data implicate FIGLA as a central regulator of oocyte-specific genes that play roles in folliculogenesis, fertilization and early development.


Figures

Figure 1
Figure 1
Differential gene expression in normal and Figla null ovaries. A. Embryonic ovarian transcriptomes of normal and Figla null mice at embryonic days E12.5, E14.5, E17.5 and newborn. For elements in the NIA microarray, the mean intensity ratio log2 null (red) over normal (blue) on X axis is plotted against the average intensity ratio log2 null and normal on Y axis. Data represent mean of 3–4 independent biological samples with Cy3 and Cy5 dye reversals and spiked Ambion RNA controls. B. Same as (A) except restricted to expression profiles of 203 newborn genes regulated by FIGLA (≥ 2 fold, ρ ≤ 0.05, after analysis of variance).
Figure 2
Figure 2
Hierarchical clustering of transcripts. Developmental hierarchical clustering of newborn transcripts potentially up- (A) or down-regulated (B) by FIGLA. Individual genes are represented by horizontal bar. Each lane represents an independently obtained biological sample (three for E12.5, E14.5 and E17.5; four for newborn) with Cy3 and Cy5 dye reversals indicated at the bottom. Blue represents greater abundance in the presence of FIGLA and red indicates less. Four genes [NIA:551381, NIA:H330A03, NIA:H3134D03, NIA:H3058H02] up-regulated at E17.5 and newborn are indicated with dots to the left. Genes encoding transcripts characterized in greater detail are indicated by an asterisk and are labeled to the right. Both Zp2 and Zp3 were identified by the screen, but not characterized further.
Figure 3
Figure 3
Expression of NALP genes. Tissue-specific and developmental expression of NALP genes potentially up-regulated by FIGLA. A. qRT-PCR of total RNA isolated from somatic and reproductive tract tissues normalized to HPRT and plotted relative to 100% expression in ovary. B. qRT-PCR of total ovarian RNA isolated from normal and Figla null mice at E12.5, E14.5, E17.5 and newborn and plotted relative to HPRT. Data is the average of two independently isolated biological samples, analyzed in triplicate at each developmental time point. Nalp4a (ita) and Nalp14 (iota)(shaded) were previously identified as ovary-specific and were not represented in microarray or SAGE data.
Figure 4
Figure 4
Expression of known genes. Tissue-specific and developmental expression of five known genes potentially up-regulated by FIGLA. A. qRT-PCR of total RNA isolated from somatic and reproductive tract tissues normalized to HPRT and plotted relative to 100% expression in ovary. B. qRT-PCR of total ovarian RNA isolated from normal and Figla null mice at E12.5, E14.5, E17.5 and newborn and plotted relative to HPRT. Data is the average (± s.e.m.) of two independently isolated biological samples, analyzed in triplicate at each developmental time point. Oas1d (shaded) missed the statistical cutoff because of a single (out of eight) outlying datum point.
Figure 5
Figure 5
Expression of un-annotated genes. Tissue-specific and developmental expression of five functionally un-annotated genes potentially up-regulated by FIGLA. A. qRT-PCR of total RNA isolated from somatic and reproductive tract tissues normalized to HPRT and plotted relative to 100% expression in ovary. B. qRT-PCR of total ovarian RNA isolated from normal and Figla null mice at E12.5, E14.5, E17.5 and newborn and plotted relative to HPRT. Data is the average (± s.e.m.) of two independently isolated biological samples, analyzed in triplicate at each developmental time point. [Genbank:BC052883] (shaded) missed the statistical cutoff because of a single (out of eight) outlying datum point.
Figure 6
Figure 6
In situ hybridization. In situ hybridization of the five functionally un-annotated genes potentially up-regulated by FIGLA. Paraformaldehyde fixed and paraffin embedded adult ovarian section were hybridized with digoxigenin (DIG) labeled antisense (A, C, E, G, I) or sense (B, D, F, H, J) synthetic oligonuclotides probes specific to [E330009P21Rik] (A, B), [E330017A01Rik] (C, D), [C330003B14Rik] (E, F), [E330034G19Rik] (G, H) and [Genbank:BC052883] (I, J) cDNAs.
Figure 7
Figure 7
Serial analysis of gene expression. Serial analysis of gene expression (SAGE) of newborn ovaries of normal and Figla null mice. A. Three dimensional plot of the number of SAGE tags (10 bp) in normal and Figla null newborn ovaries. B. Comparison (ρ ≤ 0.05) of transcripts that are up-regulated (blue) or down- regulated (red) by FIGLA in SAGE analysis [20] and by microarray using an FDR threshold of 5% [37]. Size of circles reflects the number of transcripts. Eleven transcripts were detected in both platforms, eight of which were up-regulated (POU5F1, ZP2, IVNS1ABP, VBP1, PADI6, RBPMS2, Genbank:EG626058, 6430591E23Rik) and three of which were down-regulated (SP3, HDAC2, OGT) in newborn normal ovaries.
Figure 8
Figure 8
Expression of FIGLA targets. Tissue-specific and developmental expression of eight genes potentially up-regulated by FIGLA in SAGE analysis. SAGE tags for each gene were absent in the Figla null newborn library and present ≥ 10 in the normal newborn library. A. Semi-quantitative RT-PCR of total RNA isolated from somatic and reproductive tract tissues with primers specific for each of the eight genes. B. qRT-PCR of total ovarian RNA isolated from normal and Figla null mice at E12.5, E13.5, E15.5, E17.5, E19.5, newborn (NB), 2dpp and 7dpp and plotted relative to HPRT. Data is the average (± s.e.m.) of 2–6 independently isolated biological samples, analyzed in triplicate at each developmental time point.

References

    1. McLaren A. Primordial germ cells in the mouse. Dev Biol. 2003;262:1–15. doi: 10.1016/S0012-1606(03)00214-8. - DOI - PubMed
    1. Brennan J, Capel B. One tissue, two fates: molecular genetic events that underlie testis versus ovary development. Nat Rev Genet. 2004;5:509–521. doi: 10.1038/nrg1381. - DOI - PubMed
    1. Parma P, Radi O, Vidal V, Chaboissier MC, Dellambra E, Valentini S, Guerra L, Schedl A, Camerino G. R-spondin1 is essential in sex determination, skin differentiation and malignancy. Nat Genet. 2006;11:1304–1309. doi: 10.1038/ng1907. - DOI - PubMed
    1. Bowles J, Knight D, Smith C, Wilhelm D, Richman J, Mamiya S, Yashiro K, Chawengsaksophak K, Wilson MJ, Rossant J, Hamada H, Koopman P. Retinoid Signaling Determines Germ Cell Fate in Mice. Science. 2006;312:596–600. doi: 10.1126/science.1125691. - DOI - PubMed
    1. Koubova J, Menke DB, Zhou Q, Capel B, Griswold MD, Page DC. Retinoic acid regulates sex-specific timing of meiotic initiation in mice. Proc Natl Acad Sci U S A. 2006;103:2474–2479. doi: 10.1073/pnas.0510813103. - DOI - PMC - PubMed

Publication types