

The human phylome
- PMID: 17567924
- PMCID: PMC2394744
- DOI: 10.1186/gb-2007-8-6-r109
The human phylome
Abstract
Background: Phylogenomics analyses serve to establish evolutionary relationships among organisms and their genes. A phylome, the complete collection of all gene phylogenies in a genome, constitutes a valuable source of information, but its use in large genomes still constitutes a technical challenge. The use of phylomes also requires the development of new methods that help us to interpret them.
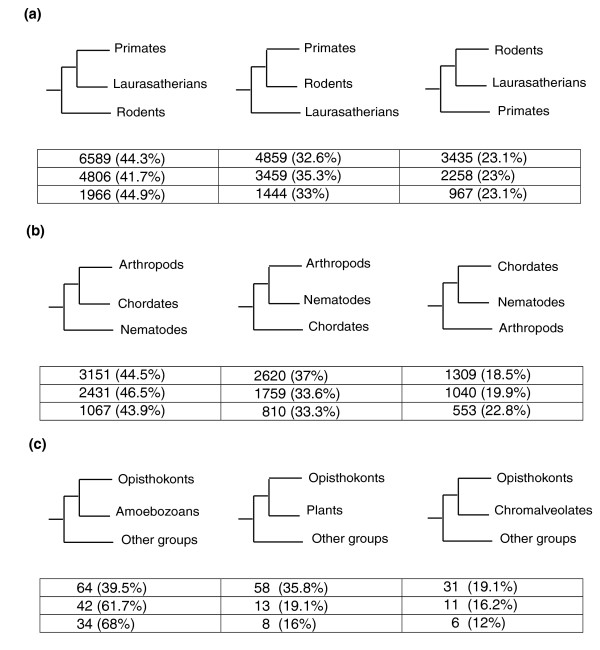
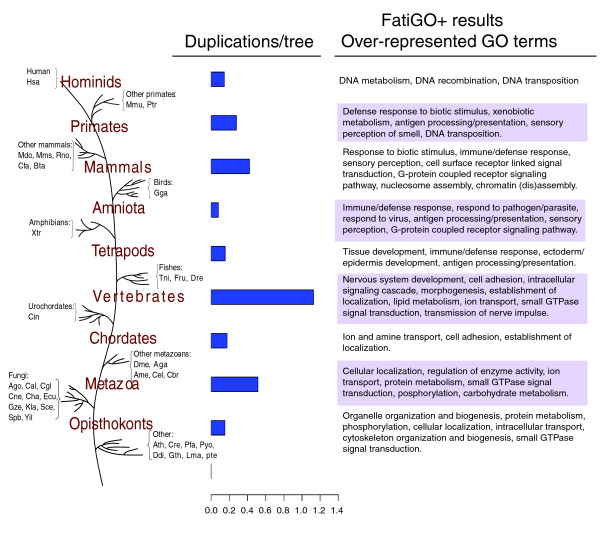
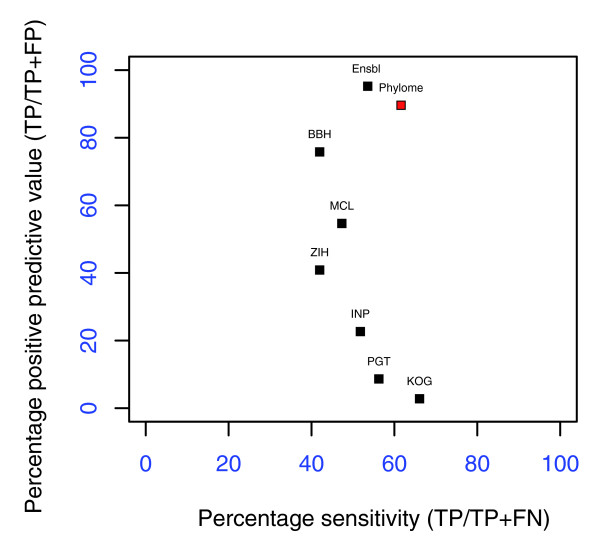
Results: We reconstruct here the human phylome, which includes the evolutionary relationships of all human proteins and their homologs among 39 fully sequenced eukaryotes. Phylogenetic techniques used include alignment trimming, branch length optimization, evolutionary model testing and maximum likelihood and Bayesian methods. Although differences with alternative topologies are minor, most of the trees support the Coelomata and Unikont hypotheses as well as the grouping of primates with laurasatheria to the exclusion of rodents. We assess the extent of gene duplication events and their relationship with the functional roles of the protein families involved. We find support for at least one, and probably two, rounds of whole genome duplications before vertebrate radiation. Using a novel algorithm that is independent from a species phylogeny, we derive orthology and paralogy relationships of human proteins among eukaryotic genomes.
Conclusion: Topological variations among phylogenies for different genes are to be expected, highlighting the danger of gene-sampling effects in phylogenomic analyses. Several links can be established between the functions of gene families duplicated at certain phylogenetic splits and major evolutionary transitions in those lineages. The pipeline implemented here can be easily adapted for use in other organisms.
Figures

Comment in
-
Topological variation in single-gene phylogenetic trees.Genome Biol. 2007;8(6):216. doi: 10.1186/gb-2007-8-6-216. Genome Biol. 2007. PMID: 17567929 Free PMC article. Review.
References
-
- McPherson JD, Marra M, Hillier L, Waterston RH, Chinwalla A, Wallis J, Sekhon M, Wylie K, Mardis ER, Wilson RK, et al. A physical map of the human genome. Nature. 2001;409:934–941. - PubMed
-
- Venter JC, Adams MD, Myers EW, Li PW, Mural RJ, Sutton GG, Smith HO, Yandell M, Evans CA, Holt RA, et al. The sequence of the human genome. Science. 2001;291:1304–1351. - PubMed
-
- Suzuki Y, Sugano S. Transcriptome analyses of human genes and applications for proteome analyses. Curr Protein Pept Sci. 2006;7:147–163. - PubMed
-
- Humphery-Smith I. A human proteome project with a beginning and an end. Proteomics. 2004;4:2519–2521. - PubMed
-
- Gandhi TK, Zhong J, Mathivanan S, Karthick L, Chandrika KN, Mohan SS, Sharma S, Pinkert S, Nagaraju S, Periaswamy B, et al. Analysis of the human protein interactome and comparison with yeast, worm and fly interaction datasets. Nat Genet. 2006;38:285–293. - PubMed
Publication types
MeSH terms
Substances
LinkOut - more resources
Full Text Sources
