. 2007 Sep;18(9):3302-12.
doi: 10.1091/mbc.e07-04-0317. Epub 2007 Jun 13.

Modulation of proteinase K-resistant prion protein in cells and infectious brain homogenate by redox iron: implications for prion replication and disease pathogenesis

Affiliations

Modulation of proteinase K-resistant prion protein in cells and infectious brain homogenate by redox iron: implications for prion replication and disease pathogenesis

Subhabrata Basu et al. Mol Biol Cell. 2007 Sep.

Abstract

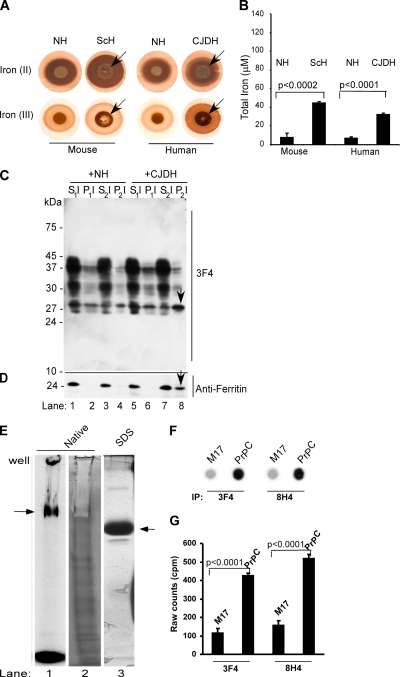
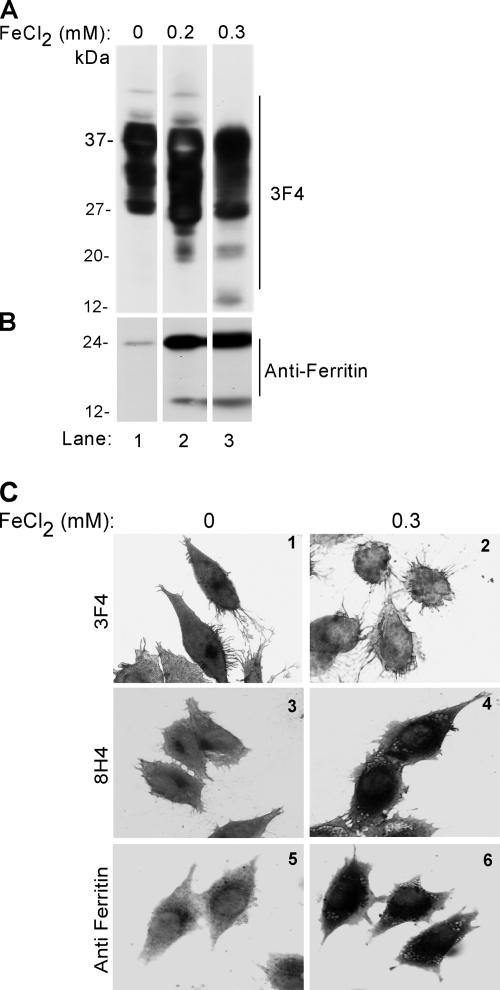
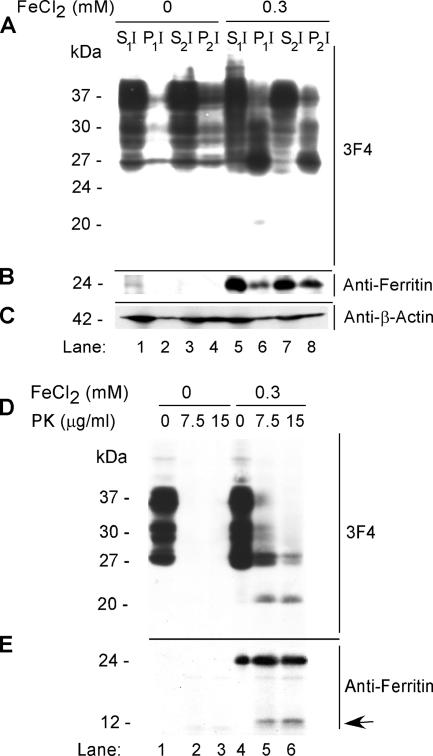
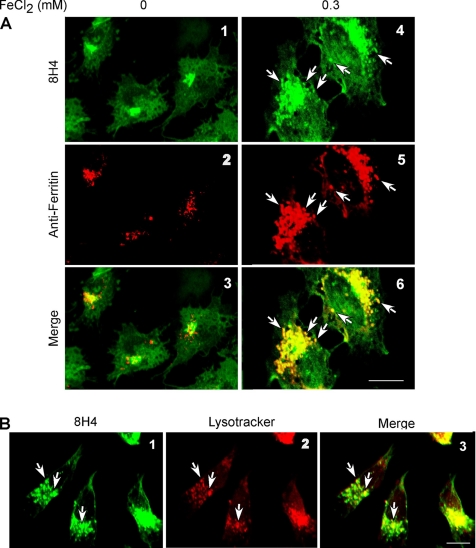
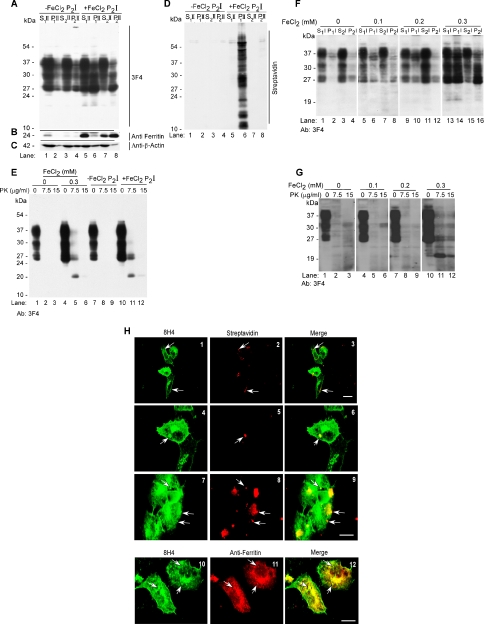
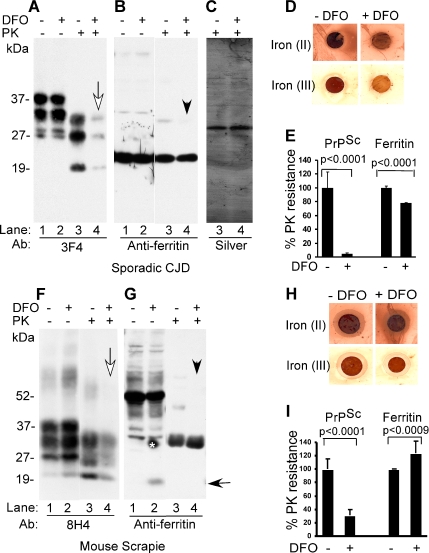
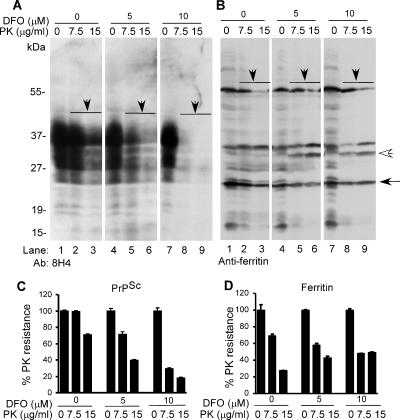
The principal infectious and pathogenic agent in all prion disorders is a beta-sheet-rich isoform of the cellular prion protein (PrP(C)) termed PrP-scrapie (PrP(Sc)). Once initiated, PrP(Sc) is self-replicating and toxic to neuronal cells, but the underlying mechanisms remain unclear. In this report, we demonstrate that PrP(C) binds iron and transforms to a PrP(Sc)-like form (*PrP(Sc)) when human neuroblastoma cells are exposed to an inorganic source of redox iron. The *PrP(Sc) thus generated is itself redox active, and it induces the transformation of additional PrP(C), simulating *PrP(Sc) propagation in the absence of brain-derived PrP(Sc). Moreover, limited depletion of iron from prion disease-affected human and mouse brain homogenates and scrapie-infected mouse neuroblastoma cells results in 4- to 10-fold reduction in proteinase K (PK)-resistant PrP(Sc), implicating redox iron in the generation, propagation, and stability of PK-resistant PrP(Sc). Furthermore, we demonstrate increased redox-active ferrous iron levels in prion disease-affected brains, suggesting that accumulation of PrP(Sc) is modulated by the combined effect of imbalance in brain iron homeostasis and the redox-active nature of PrP(Sc). These data provide information on the mechanism of replication and toxicity by PrP(Sc), and they evoke predictable and therapeutically amenable ways of modulating PrP(Sc) load.


Figures

Figure 1.
Figure 1.
(A) Equal aliquots (5 μl each) of 10% brain homogenate from normal human and mouse (NH), scrapie-infected mouse (ScH), and sCJD were blotted on PVDF membrane and reacted for ferrous and ferric iron (Smith et al., 1997). In contrast to NH, ScH and CJDH show strong reactivity for ferrous iron [Fe(II)]. Ferric iron is detected in all samples, but significantly more is in ScH and CJDH samples [Fe(III)]. (B) Colorimetric quantification of total iron shows four- to sixfold more iron in ScH and CJDH samples compared with age-matched NH controls. Unpaired t test shows highly significant mean difference between normal and diseased samples. Values for mouse samples: Δmean = 36.7; 95% confidence interval (CI) = 44.3, 29.2; t = 13.5; df = 8; p < 0.0002. Values for human samples: Δmean = 25.5; 95% CI = 29.2, 21.9; t = 19.6; df = 4; p < 0.0001). (C) Lysates of PrPC cells exposed to biotin-tagged NH or CJDH were subjected to differential centrifugation and immunoblotted with 3F4. In NH-exposed lysates, most of PrPC fractionates in the detergent-soluble S1I and S2I fractions (lanes 1 and 3). Minimal amounts of unglycosylated PrPC are detected in the low- and high-speed detergent-insoluble fractions P1I and P2I (lanes 2 and 4). In contrast, CJDH-treated lysates show a significant amount of PrP in the high-speed detergent-insoluble P2I fraction (lanes 5–8). (D) Reprobing with anti-ferritin shows slight up-regulation of ferritin in CJDH-treated lysates, 40% of which partitions in the P2I fraction (lanes 1–8, arrow). (E) Recombinant PrP radiolabeled with 59FeCl3–acetate complex shows a prominent iron-labeled band on native iron gel (lane 1) that shows a negative stain when stained with silver due to bound iron (lane 2). Minor bands that stain with silver probably represent degradation products that do not bind iron. Fractionation on SDS-PAGE and silver staining shows a single prominent band of recombinant PrP (lane 3). (F) M17 and PrPC cells were radiolabeled with 59FeCl3–citrate complex for 4 h and subjected to immunoprecipitation with 3F4 and 8H4. Eluted proteins were spotted on PVDF membrane followed by autoradiography. (G) Quantification of iron-labeled proteins in the immunoprecipitate by direct gamma-counting. n = 5. Unpaired t test shows highly significant mean difference between iron-labeled PrP immunoprecipitated from M17 and PrPC cells. Values for 3F4 immunoprecipitates: Δmean = 313.1; 95% CI = 348.9, 277.3; t = 24.3; df = 8; p < 0.0001. Values for 8H4 immunoprecipitates: Δmean = 362.5; 95% CI = 404.2, 320.8; t = 24.15; df = 8; p < 0.0001.
Figure 2.
Figure 2.
(A) Immunoblotting of mock-treated lysates with 3F4 shows the expected glycoforms of PrPC (lane 1). After exposure to 0.2 or 0.3 mM FeCl2, additional bands of 26, 20, and 12 kDa are detected (lanes 2 and 3). (B) Reprobing for ferritin shows a significant increase in ferritin signal by exposure to 0.2 and 0.3 mM FeCl2, and appearance of a 14-kDa cleavage product. (C) Mock and 0.3 mM FeCl2-treated PrPC cells were permeabilized and immunoreacted with 3F4, 8H4, or anti-ferritin antibodies. After incubation with appropriate peroxidase-conjugated secondary antibodies, the cells were reacted with DAB and observed. Mock-treated cells show PrP reaction in the Golgi region with both 3F4 and 8H4 antibodies (1 and 3). In contrast, FeCl2-treated cells do not react with 3F4, but they show a strong reaction with 8H4 (panels 2 and 4). Strong reactivity for ferritin is observed in FeCl2 exposed cells in comparison to mock-treated controls (5 and 6).
Figure 3.
Figure 3.
(A) Mock- and 0.3 mM FeCl2-exposed cell lysates were fractionated by differential centrifugation and immunoblotted with 3F4. As expected, the majority of PrPC from mock-treated lysates partitions in the detergent-soluble S1I and S2I fractions (lanes 1 and 3), with minimal amounts in the P1I and P2I fractions (lanes 2 and 4). In contrast, significant amounts of PrPC from FeCl2-treated lysates are detected in the pellet fractions P1I and P2I (lanes 6 and 8). A minor 20-kDa fragment is observed in the P1I fraction of treated cells (lane 6). (B) Reprobing with anti-ferritin shows up-regulation of ferritin in FeCl2-treated lysates (lanes 1–8), 40% of which partitions in the P2I fraction (lane 8). (C) FeCl2 treatment has no detectable effect on the expression or solubility of β-actin. (D) Treatment of lysates prepared from mock- and FeCl2-exposed cells with 7.5 and 15 μg/ml PK results in the complete digestion of PrPC in mock-treated controls (lanes 1–3), whereas treated lysates show a 20-kDa PK-resistant fragment (lanes 4–6). (E) Reprobing with anti-ferritin shows up-regulation of ferritin in FeCl2-exposed cells (lanes 1–6) and the generation of a 14-kDa fragment by PK (lanes 5 and 6, arrow).
Figure 4.
Figure 4.
(A) Mock and 0.3 mM FeCl2-treated PrPC cells were permeabilized and immunoreacted with 8H4-anti-mouse FITC and anti-ferritin-anti-rabbit TRITC antibodies. In mock-treated cells, PrPC reaction is detected in the Golgi area, and it does not overlap with ferritin reactivity (1–3). In FeCl2-exposed cells, PrP and ferritin reactivity is severalfold higher, and PrP reaction colocalizes with ferritin (4–6). (B) Immunostaining of FeCl2-exposed cells with 8H4-anti-mouse FITC and lysosome-specific dye LysoTracker shows localization of PrP within lysosomes (1–3).
Figure 5.
Figure 5.
(A) Lysates of −FeCl2 P2I- or +FeCl2 P2I-treated PrPC cells were subjected to differential centrifugation and immunoblotted with 3F4. The majority of PrPC from −FeCl2 P2I samples fractionates in the detergent-soluble S1II and S2II fractions (lanes 1–4). In contrast, a significant proportion of PrPC from +FeCl2 P2I lysates shifts to the detergent-insoluble P1II and P2II fractions (lanes 5–8). (B) Reprobing with anti-ferritin shows up-regulation and shift to P2II fraction of a significant amount of ferritin in the +FeCl2 P2I-exposed sample (lanes 1–8). (C) Cellular β-actin levels remain unchanged under these conditions (lanes 1–8). (D) Reaction of the same membrane with streptavidin-HRP shows biotin-tagged proteins only in the P1II fraction of +FeCl2 P2I-exposed sample (lane 6). (E) Treatment of mock-, 0.3 mM FeCl2-, −FeCl2 P2I-, or +FeCl2 P2I-treated lysates with 7.5 and 15 μg/ml PK shows complete digestion of PrPC in mock- and -FeCl2 P2I-exposed samples (lanes 1–3 and 7–9). In contrast, 0.3 mM FeCl2- and +FeCl2 P2I-exposed samples show partial resistance to 7.5 μg/ml PK, resulting in the generation of a 20-kDa fragment (lanes 4–6 and 10–12). (F) Lysates of PrPC cells exposed to 0, 0.1, 0.2, and 0.3 mM FeCl2 for 72 h were subjected to differential centrifugation and immunoblotting with 3F4. The majority of PrPC from cells exposed to 0, 0.1, and 0.2 mM FeCl2 fractionates in the detergent-soluble S1I and S2I fractions (lanes 1–12). In contrast, a significant proportion of PrPC from cells exposed to 0.3 mM FeCl2 shifts to the detergent-insoluble P1I and P2I fractions (lanes 13–16). (G) Treatment of lysates from F above with 7.5 and 15 μg/ml PK shows complete digestion of PrPC from samples exposed to 0, 0.1, and 0.2 mM FeCl2 (lanes 1–9). In contrast, the sample exposed to 0.3 mM FeCl2 shows partial resistance to 7.5 and 15 μg/ml PK, resulting in the generation of 20-kDa C-terminal fragment (lanes 10–12). (H) PrPC cells exposed to biotin-tagged +FeCl2 P2I were permeabilized and reacted with 8H4-anti-mouse FITC and streptavidin-Texas Red. Streptavidin-positive aggregates are detected on the plasma membrane and in endocytic vesicles (1–3). Higher magnification of select cells from 1 to 3 shows aggregation of PrP around streptavidin-positive aggregates in some areas (4–6) and distinct PrP and streptavidin reaction in other regions (7–9). All cells show up-regulation of PrP (1–9). Coimmunostaining with 8H4-anti-mouse FITC and anti-ferritin-anti-rabbit TRITC shows colocalization of the two proteins in vesicular structures near the Golgi region (10–12).
Figure 6.
Figure 6.
(A) Control and DFO-treated sCJD homogenate and the same samples treated with PK were fractionated on SDS-PAGE and analyzed by Western blotting. Immunoblotting with 3F4 reveals normal PrP glycoforms in control and DFO-treated samples (lanes 1 and 2). Treatment with PK causes the expected shift in migration of PK-resistant PrPSc in the control sample (lane 3), whereas DFO-treated sample shows almost complete degradation of PrPSc (lane 4, white arrow). (B) Reprobing with anti-ferritin shows similar monomeric and oligomeric forms of ferritin in control and DFO-treated samples (lanes 1 and 2). However, DFO-treated samples show slight increase in sensitivity to PK, especially of oligomeric forms (lanes 3 and 4, arrowhead). (C) Silver staining shows equal amount of protein in PK-treated control and DFO-treated samples (lanes 3 and 4). (D) Reaction for ferrous and ferric iron in sCJD samples shows significant reduction in especially the ferric form after DFO treatment. (E) Quantification from four independent evaluations shows a decrease in PK-resistant PrPSc and ferritin from 99 to 10% and from 100 to 80%, respectively, after DFO treatment. n = 4. Unpaired t test shows highly significant mean difference between PK-resistant PrP and ferritin in untreated and DFO-treated CJDH. Values for PK-resistant PrP: Δmean = 95.2; 95% CI = 78.8, 111.6; t = 12.3; df = 6; p < 0.0001. Values for PK-resistant ferritin: Δmean = 21.6; 95% CI = 419.5, 23.7; t = 22.0; df = 6; p < 0.0001. (F) Immunoblotting of mouse scrapie brain homogenate with 8H4 shows the expected glycoforms of PrPSc in control and DFO-treated samples (lanes 1 and 2). After PK treatment, a significant amount of PrPSc from DFO-treated samples undergoes degradation (lanes 3 and 4). (G) Reprobing for ferritin shows prominent oligomers of ferritin migrating between 35 and 55 kDa (lanes 1 and 2), some of which are sensitive to DFO and give rise to monomeric ferritin migrating at 20 kDa (lane 2, black arrow). Treatment with PK shows increased sensitivity of monomeric and DFO-treated oligomeric forms of ferritin (lanes 3 and 4, arrowhead) (*, artifact of blotting). (H) Reaction of mouse brain homogenate for ferrous and ferric iron shows significantly less reactivity after DFO treatment. (I) Quantification shows a decrease in PK-resistant PrPSc from 98 to 25% after DFO treatment. Ferritin does not show a significant difference before or after DFO treatment. n = 4. Unpaired t test shows highly significant mean difference between PK-resistant PrP, and less significant difference between PK-resistant ferritin in untreated and DFO-treated mouse scrapie samples. Values for PK-resistant PrP: Δmean = 69.2; 95% CI = 56.4, 82.0; t = 11.4; df = 6; p < 0.0001. Values for PK-resistant ferritin: Δmean = 24.0; 95% CI = 36.6, 11.5; t = 4.0; df = 6; p < 0.0009.
Figure 7.
Figure 7.
(A) ScN2a cells were cultured for 24 h in serum-free medium supplemented with vehicle or 5 and 10 μM DFO. (Notably, cells exposed to DFO looked healthier than untreated controls after 24 h.) Subsequently, cells were washed with PBS, and lysates were treated with vehicle or 7.5 and 15 μg/ml PK for 5 min at 37°C. Resistant proteins were recovered and immunoblotted with 8H4. Control sample without DFO and PK treatment shows the expected glycoforms of PrP (lane 1), some of which are degraded by PK treatment (lanes 2 and 3). Exposure to 5 and 10 μM DFO shows a significant decrease in PK-resistant PrPSc, more so in the latter sample (lanes 4–9). (B) Reprobing for ferritin shows limited sensitivity to PK regardless of DFO treatment (lanes 1–9). Certain oligomeric forms decrease in intensity (lanes 1–9, solid arrowheads), whereas others increase following PK treatment (lanes 1–9, white arrowhead). (C) Quantification shows a significant decline in PK-resistant PrPSc from 99 to 70% and from 70 to 40% with 7.5 and 15 μg/ml PK, respectively, after exposure to 5 μM DFO. A further decline in PK-resistant PrPSc to 30 and 18%, respectively, is observed when the DFO concentration is increased to 10 μM. n = 4. (D) The total amount of PK-resistant ferritin ranges between 75 and 95% regardless of DFO treatment. n = 4.

Similar articles

Cited by

References

    1. Aguzzi A., Polymendiou M. Mammalian prion biology: one century of evolving concepts. Cell. 2004;116:313–327. - PubMed
    1. Andreoletti O., Levavasseur E., Uro-Coste E., Tabouret G., Sarradin P., Delisle M. B., Berthon P., Salvayre R., Schelcher F., Negre-Salvayre A. Astrocytes accumulate 4-hydroxynonenal adducts in murine scrapie and human Creutzfeldt-Jakob disease. Neurobiol. Dis. 2002;11:386–393. - PubMed
    1. Behl C., Davis J. B., Lesley R., Schubert D. Hydrogen peroxide mediates amyloid beta protein toxicity. Cell. 1994;77:817–827. - PubMed
    1. Bieschke J., Weber P., Sarafoff N., Beekes M., Giese A., Kretzschmar H. Autocatalytic self-propagation of misfolded prion protein. Proc. Natl. Acad. Sci. USA. 2004;101:12207–12211. - PMC - PubMed
    1. Brazier M. W., et al. Correlative studies support lipid peroxidation is linked to PrP(res) propagation as an early primary pathogenic event in prion disease. Brain Res. Bull. 2006;68:346–354. - PubMed

Publication types

MeSH terms