. 2007 Jun;17(6):746-59.
doi: 10.1101/gr.5660607.

Prominent use of distal 5' transcription start sites and discovery of a large number of additional exons in ENCODE regions

Affiliations

Prominent use of distal 5' transcription start sites and discovery of a large number of additional exons in ENCODE regions

France Denoeud et al. Genome Res. 2007 Jun.

Abstract

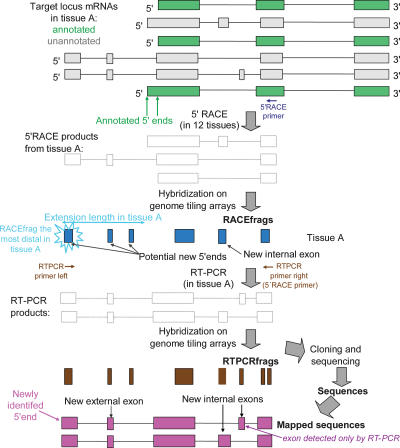
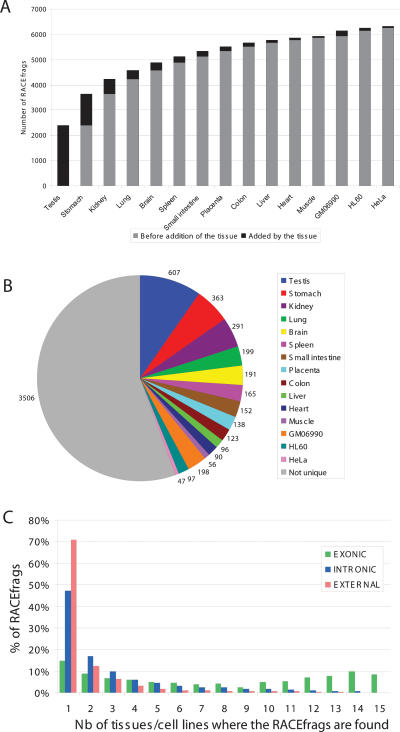
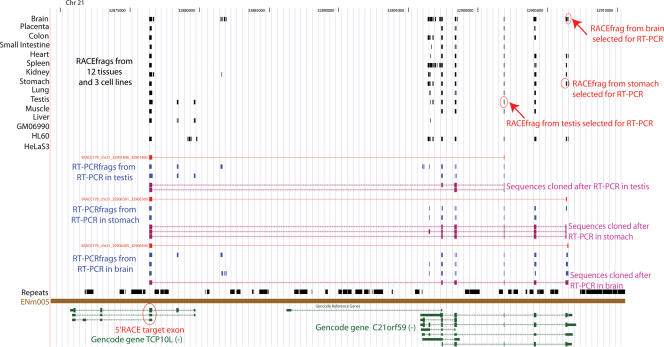
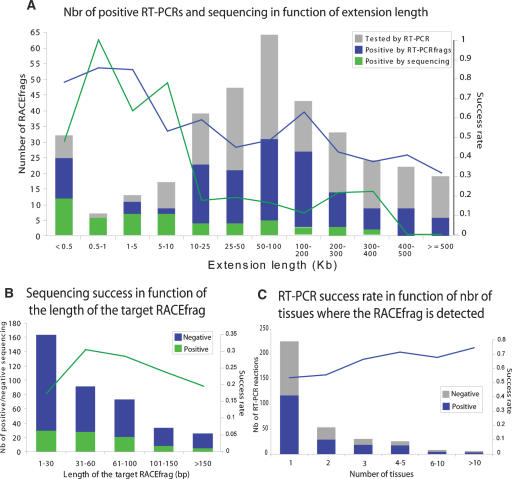
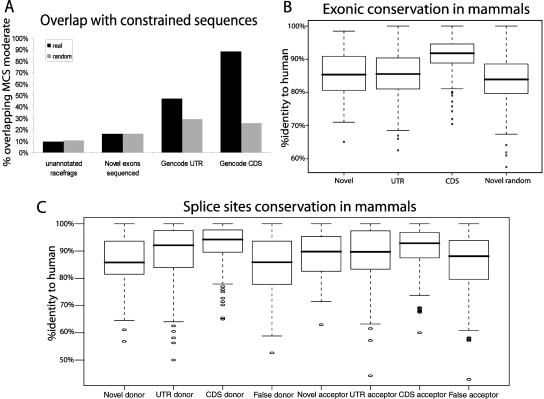
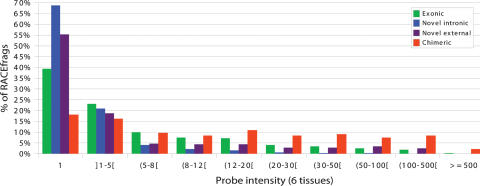
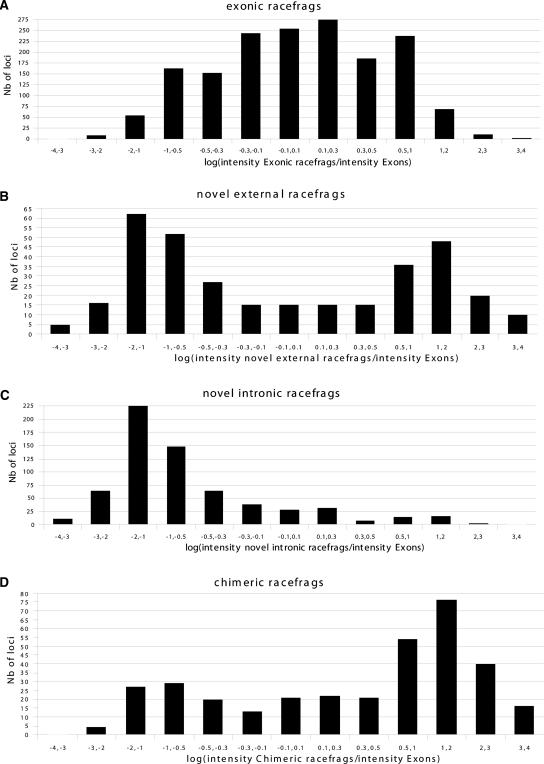
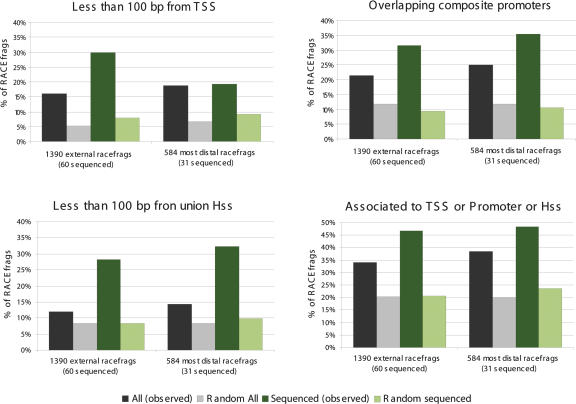
This report presents systematic empirical annotation of transcript products from 399 annotated protein-coding loci across the 1% of the human genome targeted by the Encyclopedia of DNA elements (ENCODE) pilot project using a combination of 5' rapid amplification of cDNA ends (RACE) and high-density resolution tiling arrays. We identified previously unannotated and often tissue- or cell-line-specific transcribed fragments (RACEfrags), both 5' distal to the annotated 5' terminus and internal to the annotated gene bounds for the vast majority (81.5%) of the tested genes. Half of the distal RACEfrags span large segments of genomic sequences away from the main portion of the coding transcript and often overlap with the upstream-annotated gene(s). Notably, at least 20% of the resultant novel transcripts have changes in their open reading frames (ORFs), most of them fusing ORFs of adjacent transcripts. A significant fraction of distal RACEfrags show expression levels comparable to those of known exons of the same locus, suggesting that they are not part of very minority splice forms. These results have significant implications concerning (1) our current understanding of the architecture of protein-coding genes; (2) our views on locations of regulatory regions in the genome; and (3) the interpretation of sequence polymorphisms mapping to regions hitherto considered to be "noncoding," ultimately relating to the identification of disease-related sequence alterations.


Figures

Figure 1.
Figure 1.
Schematic comparison of RACEfrags and RT-PCRfrags with annotated and unannotated transcripts. The locus to be interrogated is transcribed in alternatively spliced annotated (green) and unannotated (gray) isoforms. Rapid amplification of 5′ cDNA ends (5′ RACE) with a primer (blue arrow) mapping to a coding exon common to most of the transcripts (the index exon) results in a mix of cDNAs (ghost transcripts), which are hybridized to high-resolution tiling arrays to detect “RACEfrags” (blue boxes). RACEfrags are transcribed fragments specifically linked to the targeted coding locus. The connectivity between a RACEfrag overlapping an unannotated exon and the index exon can be verified by RT-PCR with two specific primers (brown arrows). This reaction produces a combination of overlapping alternatively spliced transcripts (ghost transcripts) that identify “RT-PCRfrags” upon hybridization to the same tiling array (brown boxes). Thus, RT-PCRfrags are transcribed fragments that link two targeted exons. Alternatively, these transcripts can be cloned and sequenced to precisely determine the beginning and the end of the novel exons and the exon composition of the transcripts (purple boxes). Because tiling arrays interrogate only nonrepeated regions and as they have a 20-bp resolution, RACEfrags and RT-PCRfrags do not fully overlap exons.
Figure 2.
Figure 2.
A large proportion of RACEfrags are tissue-specific. (A) Cumulative number of RACEfrags identified in the 12 tissues and three cell lines; (B) numbers of RACEfrags specific to a single tissue; (C) proportion of exonic (green), intronic (blue), and external (orange) RACEfrags identified by one, two, three, or more tissues.
Figure 3.
Figure 3.
Example of a transcription-induced chimera between C21orf59 and TCP10L. The results of a 5′ RACE/tiling array analysis of the HSA21 TCP10L gene are presented. The GENCODE-annotated transcripts of this section of the ENCODE region ENm005 are shown (green, at the bottom). The index exon where the primer used for the 5′ RACE maps is indicated. RACEfrags-positive regions obtained upon hybridization of the tiling array by the RACE reactions performed in 12 human tissues and three cell lines are shown (black boxes, upper part). Red boxes joined by thin red lines depict connectivity between index exons and RACEfrags selected to be independently verified by RT-PCR. The corresponding RACEfrags are highlighted in the upper part of the panel. The hybridization of these RT-PCR reactions to the same tiling arrays allowed us to identify RT-PCRfrags (blue boxes, see text for details). Note that some of the RT-PCRfrags do not intersect RACEfrags, denoting that not all transcripts were detected by the RACE reactions. The cloning and sequencing of the RT-PCR reactions amplimers’ revealed the exon composition and chimeric nature of transcripts containing the targeted RACEfrags (purple transcripts).
Figure 4.
Figure 4.
Characteristics of RACEfrags subjected to RT-PCR, cloning, and sequencing and success rates. Distributions of RACEfrags selected to be independently verified by RT-PCR according to the genomic distance separating them from their index exon (A), their lengths (B), or the number of tissues where they were detected (C). The histograms (Y-axis scale on the left) show the fractions of RACEfrags successfully confirmed only by RT-PCRfrags (blue, see text for details), or by RT-PCRfrags, cloning, and sequencing (green). The curves (Y-axis scale on the right) indicate the success rate by hybridization (blue curve) or by hybridization, cloning, and sequencing (green curve).
Figure 5.
Figure 5.
Evolutionary conservation of RACEfrags. (A) Overlap of four data sets with constrained sequences. For each dataset, the percentage of projected (black) and random objects (gray; same sizes as real objects but randomly distributed in nonrepeated regions and unannotated for RACEfrags or novel exons) overlapping MCS (Multi-species Conserved Sequences)-constrained sequences by at least one nucleotide are represented on the Y-axis. Please note that GENCODE UTR and GENCODE CDS show an overlap with MCS significantly greater than random sequences. (B) Exonic conservation in mammals. For each dataset, a boxplot depicting the distribution of nucleotide conservation scores is shown. Conservation is computed as the percent identity to the human sequence for the entire length of the feature. The heavy black line marks the median score, the box contains the second and third quartiles, and whiskers mark the fifth and ninety-fifth percentiles. Novel random features are randomly chosen from unannotated nonrepetitive regions that exhibit the same size distribution as novel exons. For CDS features, a random nonredundant subset of GENCODE-annotated known coding exons was used. The CDS exons are significantly more conserved than the other features. Note that the novel sequenced exons and GENCODE UTR exons are significantly more conserved than random sequences (Novel random). (C) Splice sites conservation in mammals. For each data set, donor sequences (−2 to +6 with respect to the 5′ splice junction) and acceptor sequences (−6 to +2 with respect to the 3′ splice junction) were scored for conservation to the human splice site sequence. Boxplots were produced as in B. False splice sites were picked at random from the set of all GT or AG dinucleotides in ENCODE regions that do not overlap GENCODE-annotated exons or repeats. UTR and CDS donors and CDS acceptors are significantly more conserved than false splice sites (random GT or AG). Novel splice sites do not exhibit elevated conservation over background.
Figure 6.
Figure 6.
Intensity signal registered for RACEfrags. Distribution of exonic (green columns), novel intronic (blue columns), novel external (purple columns), and chimeric (red columns) RACEfrags according to the intensity signals measured on probes overlapping the regions where they map in six tissues. Intensity values are represented on the X-axis. Values of 1 mean no signal (ratio of 1 compared with control), as positive probes have intensity >1. The percentage of RACEfrags in each intensity bin is given on the Y-axis.
Figure 7.
Figure 7.
Expression levels of RACEfrags. Distribution of ratios of intensity signals measured for probes overlapping different subsets of RACEfrags: exonic (A), novel external (B), novel intronic (C), and chimeric (D). The expression levels in the different sets were calculated by averaging the median intensities of positive probes in each RACEfrags/exons among all the exons/RACEfrags in the set. The ratios are calculated as the intensity level obtained in the considered set of RACEfrags divided by the intensity level obtained for exons from the target locus. The bins on the X-axis represent the log of the ratios (logs between −0.3 and 0.3 correspond to ratios between 0.5- and twofold).
Figure 8.
Figure 8.
Overlap of RACEfrags with 5′ ends related data sets. Proportion of RACEfrags (gray) and sequence-validated RACEfrags (green) in the real (dark color) and random (light color) sets at <100 bp from transcription start sites (TSS; top left), overlapping composite promoters (top right), at <100 bp from DNase I hypersensitive sites (Hss; bottom left), and their union (bottom right). The data are shown for the 1390 external RACEfrags and 584 5′ most distal RACEfrags and their sequenced subsets on the left- and righthand side, respectively.
Figure 9.
Figure 9.
Overlap of RACEfrags with protein-binding sites and chromatin modifications. Proportion of RACEfrags in the real (dark gray) and random (light gray) sets overlapping protein-binding or chromatin modification sites. Significant enrichments (green) and reductions (red) (p < 0.05) are highlighted. The data are shown for the 791 RACEfrags, protein-binding, and chromatin modification sites identified in HL60 cells.

References

    1. Adams M.D., Celniker S.E., Holt R.A., Evans C.A., Gocayne J.D., Amanatides P.G., Scherer S.E., Li P.W., Hoskins R.A., Galle R.F., Celniker S.E., Holt R.A., Evans C.A., Gocayne J.D., Amanatides P.G., Scherer S.E., Li P.W., Hoskins R.A., Galle R.F., Holt R.A., Evans C.A., Gocayne J.D., Amanatides P.G., Scherer S.E., Li P.W., Hoskins R.A., Galle R.F., Evans C.A., Gocayne J.D., Amanatides P.G., Scherer S.E., Li P.W., Hoskins R.A., Galle R.F., Gocayne J.D., Amanatides P.G., Scherer S.E., Li P.W., Hoskins R.A., Galle R.F., Amanatides P.G., Scherer S.E., Li P.W., Hoskins R.A., Galle R.F., Scherer S.E., Li P.W., Hoskins R.A., Galle R.F., Li P.W., Hoskins R.A., Galle R.F., Hoskins R.A., Galle R.F., Galle R.F., et al. The genome sequence of Drosophila melanogaster. Science. 2000;287:2185–2195. - PubMed
    1. Akiva P., Toporik A., Edelheit S., Peretz Y., Diber A., Shemesh R., Novik A., Sorek R., Toporik A., Edelheit S., Peretz Y., Diber A., Shemesh R., Novik A., Sorek R., Edelheit S., Peretz Y., Diber A., Shemesh R., Novik A., Sorek R., Peretz Y., Diber A., Shemesh R., Novik A., Sorek R., Diber A., Shemesh R., Novik A., Sorek R., Shemesh R., Novik A., Sorek R., Novik A., Sorek R., Sorek R. Transcription-mediated gene fusion in the human genome. Genome Res. 2006;16:30–36. - PMC - PubMed
    1. Ashburner M., Ball C.A., Blake J.A., Botstein D., Butler H., Cherry J.M., Davis A.P., Dolinski K., Dwight S.S., Eppig J.T., Ball C.A., Blake J.A., Botstein D., Butler H., Cherry J.M., Davis A.P., Dolinski K., Dwight S.S., Eppig J.T., Blake J.A., Botstein D., Butler H., Cherry J.M., Davis A.P., Dolinski K., Dwight S.S., Eppig J.T., Botstein D., Butler H., Cherry J.M., Davis A.P., Dolinski K., Dwight S.S., Eppig J.T., Butler H., Cherry J.M., Davis A.P., Dolinski K., Dwight S.S., Eppig J.T., Cherry J.M., Davis A.P., Dolinski K., Dwight S.S., Eppig J.T., Davis A.P., Dolinski K., Dwight S.S., Eppig J.T., Dolinski K., Dwight S.S., Eppig J.T., Dwight S.S., Eppig J.T., Eppig J.T., et al. Gene ontology: Tool for the unification of biology. The Gene Ontology Consortium. Nat. Genet. 2000;25:25–29. - PMC - PubMed
    1. Bertone P., Stolc V., Royce T.E., Rozowsky J.S., Urban A.E., Zhu X., Rinn J.L., Tongprasit W., Samanta M., Weissman S., Stolc V., Royce T.E., Rozowsky J.S., Urban A.E., Zhu X., Rinn J.L., Tongprasit W., Samanta M., Weissman S., Royce T.E., Rozowsky J.S., Urban A.E., Zhu X., Rinn J.L., Tongprasit W., Samanta M., Weissman S., Rozowsky J.S., Urban A.E., Zhu X., Rinn J.L., Tongprasit W., Samanta M., Weissman S., Urban A.E., Zhu X., Rinn J.L., Tongprasit W., Samanta M., Weissman S., Zhu X., Rinn J.L., Tongprasit W., Samanta M., Weissman S., Rinn J.L., Tongprasit W., Samanta M., Weissman S., Tongprasit W., Samanta M., Weissman S., Samanta M., Weissman S., Weissman S., et al. Global identification of human transcribed sequences with genome tiling arrays. Science. 2004;306:2242–2246. - PubMed
    1. Bray N., Pachter L., Pachter L. MAVID: Constrained ancestral alignment of multiple sequences. Genome Res. 2004;14:693–699. - PMC - PubMed

Publication types

Substances

LinkOut - more resources