. 2007 Jun;17(6):839-51.
doi: 10.1101/gr.5586307.

Pseudogenes in the ENCODE regions: consensus annotation, analysis of transcription, and evolution

Affiliations

Pseudogenes in the ENCODE regions: consensus annotation, analysis of transcription, and evolution

Deyou Zheng et al. Genome Res. 2007 Jun.

Abstract

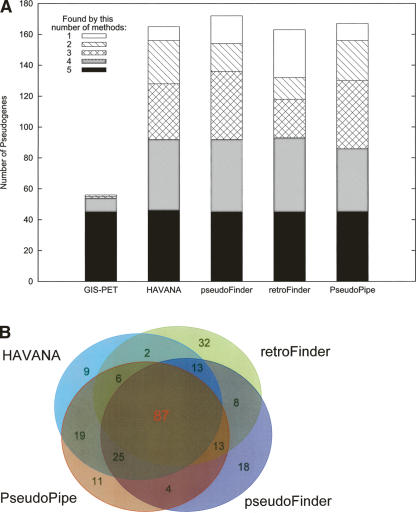
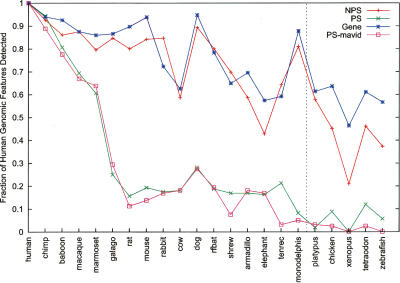
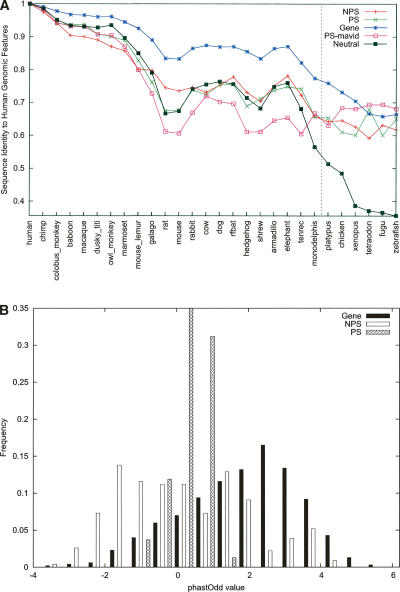
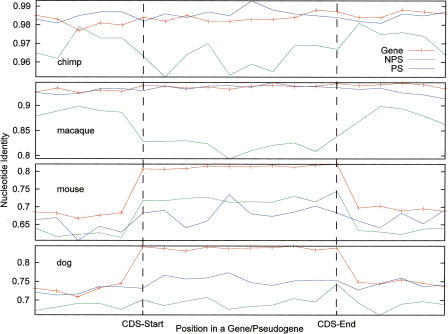
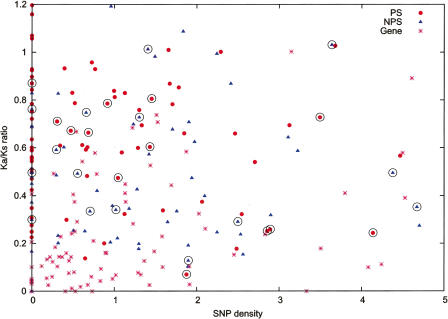
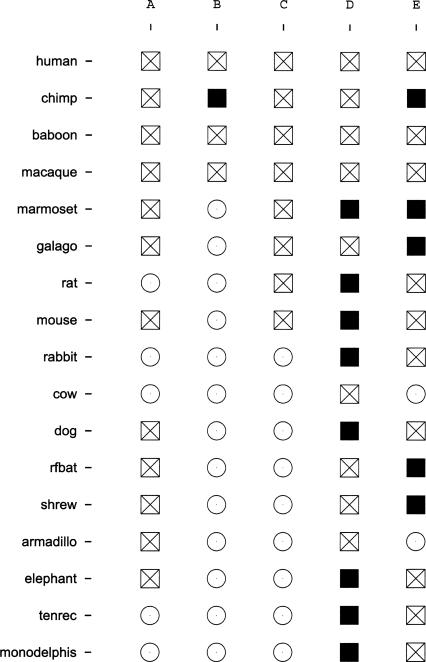
Arising from either retrotransposition or genomic duplication of functional genes, pseudogenes are "genomic fossils" valuable for exploring the dynamics and evolution of genes and genomes. Pseudogene identification is an important problem in computational genomics, and is also critical for obtaining an accurate picture of a genome's structure and function. However, no consensus computational scheme for defining and detecting pseudogenes has been developed thus far. As part of the ENCyclopedia Of DNA Elements (ENCODE) project, we have compared several distinct pseudogene annotation strategies and found that different approaches and parameters often resulted in rather distinct sets of pseudogenes. We subsequently developed a consensus approach for annotating pseudogenes (derived from protein coding genes) in the ENCODE regions, resulting in 201 pseudogenes, two-thirds of which originated from retrotransposition. A survey of orthologs for these pseudogenes in 28 vertebrate genomes showed that a significant fraction ( approximately 80%) of the processed pseudogenes are primate-specific sequences, highlighting the increasing retrotransposition activity in primates. Analysis of sequence conservation and variation also demonstrated that most pseudogenes evolve neutrally, and processed pseudogenes appear to have lost their coding potential immediately or soon after their emergence. In order to explore the functional implication of pseudogene prevalence, we have extensively examined the transcriptional activity of the ENCODE pseudogenes. We performed systematic series of pseudogene-specific RACE analyses. These, together with complementary evidence derived from tiling microarrays and high throughput sequencing, demonstrated that at least a fifth of the 201 pseudogenes are transcribed in one or more cell lines or tissues.


Figures

Figure 1.
Figure 1.
Comparison of results from five methods of pseudogene identification. (A) Pseudogenes annotated by a method were binned into groups based on the number of methods that recognized them as pseudogenes. In this scheme, method-specific pseudogenes were labeled as (found by) “1” method. (B) A four-way comparison of pseudogenes identified by HAVANA, PseudoPipe, retroFinder, and pseudoFinder. Note: one pseudogene could overlap more than one pseudogene from other method(s).
Figure 2.
Figure 2.
The distribution of genes and the final 201 consensus pseudogenes within 44 ENCODE regions. Both genes and pseudogenes were concentrated in the manually picked regions (001–014).
Figure 3.
Figure 3.
A pseudogene with multiple evidence of transcription. This is a processed pseudogene identified by all five methods (in pink). The evidence of transcription includes RACEfrags, EST, GIS-PET, Riken CAGE, and transfrags (Affy RNA or Yale TARs). Near its 5′-end there is a putative promoter region (ENCODE_ChIP, top) derived from many ChIP-chip experiments targeted at DNA elements regulating transcription.
Figure 4.
Figure 4.
Preservation of human genomic components in other species. The number of human pseudogenes (or genes) with orthologous sequences in individual species was computed and then plotted (by normalization with the total number in human) against each species. Only exons (or pseudoexons) were used in these analyses; (NPS) nonprocessed and (PS) processed pseudogenes. Data were derived from sequence alignment constructed by the program TBA except PS-mavid, which was by MAVID. Note that species with sequences available for the ENm001 region only are omitted in this figure. A more comprehensive plot (of this figure and also Fig. 5A) with data for introns and other genomic data can be found in Supplemental Figures S1 and S2. The data for non-mammalian species (right of the vertical line) should be taken with more caution because ortholog assignments for these species are likely more difficult.
Figure 5.
Figure 5.
ENCODE pseudogenes overall exhibit a characteristic pattern of neutral evolution. (A) The orthologous sequences of each human genomic component (e.g., pseudogene) were retrieved from MSA data, and pairwise nucleotide sequence identity was calculated. Shown here are the means for each type of components (data labeled as in Fig. 4). A line representing neutral evolution is also shown using data derived from fourfold degenerate sites. (B) A score based on the log-likelihood of observing a genomic fragment under a model of constrained versus neutral evolution was computed for individual exons of genes or pseudogenes using the phastOdds program (Siepel et al. 2005). These scores were then normalized by exon length and plotted here as a histogram. A value near zero or negative indicates that the evolution of a sequence can be described better by a neutral model.
Figure 6.
Figure 6.
Comparison of sequence conservation for genes and pseudogenes in the context of adjacent genomic sequences. The orthologous sequences in chimp, macaque, mouse, and dog were retrieved from the MSA data for protein “coding” regions (CDS) of genes and pseudogenes. Their regions were divided into 10 blocks, and pairwise nucleotide sequence identities were calculated for each block. The data shown here are the means for all genes or processed (PS) or nonprocessed (NPS) pseudogenes. For comparison, 500-bp upstream and downstream sequences of CDSs were also analyzed. The P-values of the t-test for the differences between genes and pseudogenes (for all four species) and between NPS and PS (in chimp and macaque) are <0.01.
Figure 7.
Figure 7.
Comparison of Ka/Ks ratio and SNP density for genes and pseudogenes. Only the CDS of a gene or pseudogene was used for analyses of Ka/Ks ratio and SNP density (number of SNP per 300 nucleotides). The Ka/Ks ratio was derived from the sequences between baboon and human. Data for transcribed pseudogenes are circled, and they are not statistically significant from the rest.
Figure 8.
Figure 8.
Detection and disabled pattern of pseudogene orthologs. For each pseudogene, its orthologous sequences were retrieved and compared to the parent protein sequence. Respectively, boxes and circles represent whether a pseudogene ortholog is detected or not in a species. A cross (×) means that the hypothetical CDS is disabled. Data for non-mammalian species are not shown. The five pseudogenes shown here are (from A to E) CTA-440B3.1-001 (ENm004, PS), RP11-374F3.2-001 (ENr111, PS), RP11-98F14.4-001 (ENr132, PS), AC087380.17-001 (ENm009, NPS), and AC087380.14-001 (ENm009, NPS).
Figure 9.
Figure 9.
Complexity in pseudogene annotation—insertion of one pseudogene into another. A set of “nested” pseudogenes (in green) was found in the ENm001 region with protein homology (shown in blue) supporting the annotation. This arrangement appears to have been generated through the insertion of a heterogeneous nuclear ribonucleoprotein A1 (HNRPA1) processed pseudogene (1) into the genome on the negative strand. This was followed by a second insertion event in which a transcript originating from the mitochondrial genome was transposed into the HNRPA1 pseudogene sequence. Gene order and orientation suggest that this mitochondria-derived sequence has undergone further rearrangement, including deletions, to leave an NADH dehydrogenase 2 (MTND2) pseudogene (2a) and an NADH dehydrogenase 4 (MTND4) pseudogene (2b) on the positive strand and a cytochrome B (CYTB) pseudogene (2c) on the negative strand. A view of the protein alignment for the 5′-end of the HNRPA1 pseudogene (in yellow) is shown with an in-frame stop codon (indicated by *) and a shift from frame +2 to +3 (highlighted by the red box) clearly visible.

Similar articles

Cited by

References

    1. Bairoch A., Apweiler R., Wu C.H., Barker W.C., Boeckmann B., Ferro S., Gasteiger E., Huang H., Lopez R., Magrane M., Apweiler R., Wu C.H., Barker W.C., Boeckmann B., Ferro S., Gasteiger E., Huang H., Lopez R., Magrane M., Wu C.H., Barker W.C., Boeckmann B., Ferro S., Gasteiger E., Huang H., Lopez R., Magrane M., Barker W.C., Boeckmann B., Ferro S., Gasteiger E., Huang H., Lopez R., Magrane M., Boeckmann B., Ferro S., Gasteiger E., Huang H., Lopez R., Magrane M., Ferro S., Gasteiger E., Huang H., Lopez R., Magrane M., Gasteiger E., Huang H., Lopez R., Magrane M., Huang H., Lopez R., Magrane M., Lopez R., Magrane M., Magrane M., et al. The Universal Protein Resource (UniProt) Nucleic Acids Res. 2005;33:D154–D159. - PMC - PubMed
    1. Balakirev E.S., Ayala F.J., Ayala F.J. Pseudogenes: Are they “junk” or functional DNA? Annu. Rev. Genet. 2003;37:123–151. - PubMed
    1. Bertone P., Stolc V., Royce T.E., Rozowsky J.S., Urban A.E., Zhu X., Rinn J.L., Tongprasit W., Samanta M., Weissman S., Stolc V., Royce T.E., Rozowsky J.S., Urban A.E., Zhu X., Rinn J.L., Tongprasit W., Samanta M., Weissman S., Royce T.E., Rozowsky J.S., Urban A.E., Zhu X., Rinn J.L., Tongprasit W., Samanta M., Weissman S., Rozowsky J.S., Urban A.E., Zhu X., Rinn J.L., Tongprasit W., Samanta M., Weissman S., Urban A.E., Zhu X., Rinn J.L., Tongprasit W., Samanta M., Weissman S., Zhu X., Rinn J.L., Tongprasit W., Samanta M., Weissman S., Rinn J.L., Tongprasit W., Samanta M., Weissman S., Tongprasit W., Samanta M., Weissman S., Samanta M., Weissman S., Weissman S., et al. Global identification of human transcribed sequences with genome tiling arrays. Science. 2004;306:2242–2246. - PubMed
    1. Birney E., Clamp M., Durbin R., Clamp M., Durbin R., Durbin R. GeneWise and Genomewise. Genome Res. 2004;14:988–995. - PMC - PubMed
    1. Bischof J.M., Chiang A.P., Scheetz T.E., Stone E.M., Casavant T.L., Sheffield V.C., Braun T.A., Chiang A.P., Scheetz T.E., Stone E.M., Casavant T.L., Sheffield V.C., Braun T.A., Scheetz T.E., Stone E.M., Casavant T.L., Sheffield V.C., Braun T.A., Stone E.M., Casavant T.L., Sheffield V.C., Braun T.A., Casavant T.L., Sheffield V.C., Braun T.A., Sheffield V.C., Braun T.A., Braun T.A. Genome-wide identification of pseudogenes capable of disease-causing gene conversion. Hum. Mutat. 2006;27:545–552. - PubMed

Publication types