

Detection of DNA structural motifs in functional genomic elements
- PMID: 17568009
- PMCID: PMC1891352
- DOI: 10.1101/gr.5602807
Detection of DNA structural motifs in functional genomic elements
Abstract
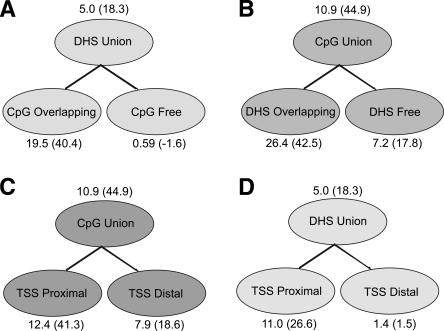
The completion of the human genome project has fueled the search for regulatory elements by a variety of different approaches. Many successful analyses have focused on examining primary DNA sequence and/or chromatin structure. However, it has been difficult to detect common sequence motifs within the feature of chromatin structure most closely associated with regulatory elements, DNase I hypersensitive sites (DHSs). Considering just the nucleotide sequence and/or the chromatin structure of regulatory elements may neglect a critical feature of what is recognized by the regulatory machinery--DNA structure. We introduce a new computational method to detect common DNA structural motifs in a large collection of DHSs that are found in the ENCODE regions of the human genome. We show that DHSs have common DNA structural motifs that show no apparent sequence consensus. One such structural motif is much more highly enriched in experimentally identified DHSs that are in CpG islands and near transcription start sites (TSSs), compared to DHSs not in CpG islands and farther from TSSs, suggesting that DNA structural motifs may participate in the formation of functional regulatory elements. We propose that studies of the conservation of DNA structure, independent of sequence conservation, will provide new information about the link between the nucleotide sequence of a DNA molecule and its experimentally demonstrated function.
Figures
References
-
- Baylin S.B., Herman J.G., Graff J.R., Vertino P.M., Issa J.P., Herman J.G., Graff J.R., Vertino P.M., Issa J.P., Graff J.R., Vertino P.M., Issa J.P., Vertino P.M., Issa J.P., Issa J.P. Alterations in DNA methylation: A fundamental aspect of neoplasia. Adv. Cancer Res. 1998;72:141–196. - PubMed
-
- Bird A. DNA methylation patterns and epigenetic memory. Genes & Dev. 2002;16:6–21. - PubMed
-
- Crawford G., Holt I., Mullikin J., Tai D., Blakesley R., Bouffard G., Young A., Masiello C., Green E., Wolfsberg T., Holt I., Mullikin J., Tai D., Blakesley R., Bouffard G., Young A., Masiello C., Green E., Wolfsberg T., Mullikin J., Tai D., Blakesley R., Bouffard G., Young A., Masiello C., Green E., Wolfsberg T., Tai D., Blakesley R., Bouffard G., Young A., Masiello C., Green E., Wolfsberg T., Blakesley R., Bouffard G., Young A., Masiello C., Green E., Wolfsberg T., Bouffard G., Young A., Masiello C., Green E., Wolfsberg T., Young A., Masiello C., Green E., Wolfsberg T., Masiello C., Green E., Wolfsberg T., Green E., Wolfsberg T., Wolfsberg T., et al. Identifying 174 gene regulatory elements by genome-wide recovery of DNase hypersensitive sites. Proc. Natl. Acad. Sci. 2004;101:992–997. - PMC - PubMed
-
- Crawford G.E., Davis S., Scacheri P.C., Renaud G., Halawi M., Erdos M.R., Green R., Meltzer P.S., Wolfsberg T.G., Collins F.S., Davis S., Scacheri P.C., Renaud G., Halawi M., Erdos M.R., Green R., Meltzer P.S., Wolfsberg T.G., Collins F.S., Scacheri P.C., Renaud G., Halawi M., Erdos M.R., Green R., Meltzer P.S., Wolfsberg T.G., Collins F.S., Renaud G., Halawi M., Erdos M.R., Green R., Meltzer P.S., Wolfsberg T.G., Collins F.S., Halawi M., Erdos M.R., Green R., Meltzer P.S., Wolfsberg T.G., Collins F.S., Erdos M.R., Green R., Meltzer P.S., Wolfsberg T.G., Collins F.S., Green R., Meltzer P.S., Wolfsberg T.G., Collins F.S., Meltzer P.S., Wolfsberg T.G., Collins F.S., Wolfsberg T.G., Collins F.S., Collins F.S. DNase-chip: A high resolution method to identify DNaseI hypersensitive sites using tiled microarrays. Nat. Methods. 2006a;3:503–509. - PMC - PubMed
Publication types
MeSH terms
Substances
Grants and funding
LinkOut - more resources
Full Text Sources
Other Literature Sources
Research Materials