. 2007 Oct 1;62(7):711-21.
doi: 10.1016/j.biopsych.2006.12.021. Epub 2007 Jun 13.

Molecular evidence for increased expression of genes related to immune and chaperone function in the prefrontal cortex in schizophrenia

Affiliations

Molecular evidence for increased expression of genes related to immune and chaperone function in the prefrontal cortex in schizophrenia

Dominique Arion et al. Biol Psychiatry. .

Abstract

Background: Schizophrenia is characterized by complex gene expression changes. The transcriptome alterations in the prefrontal cortex have been the subject of several recent postmortem studies that yielded both convergent and divergent findings.

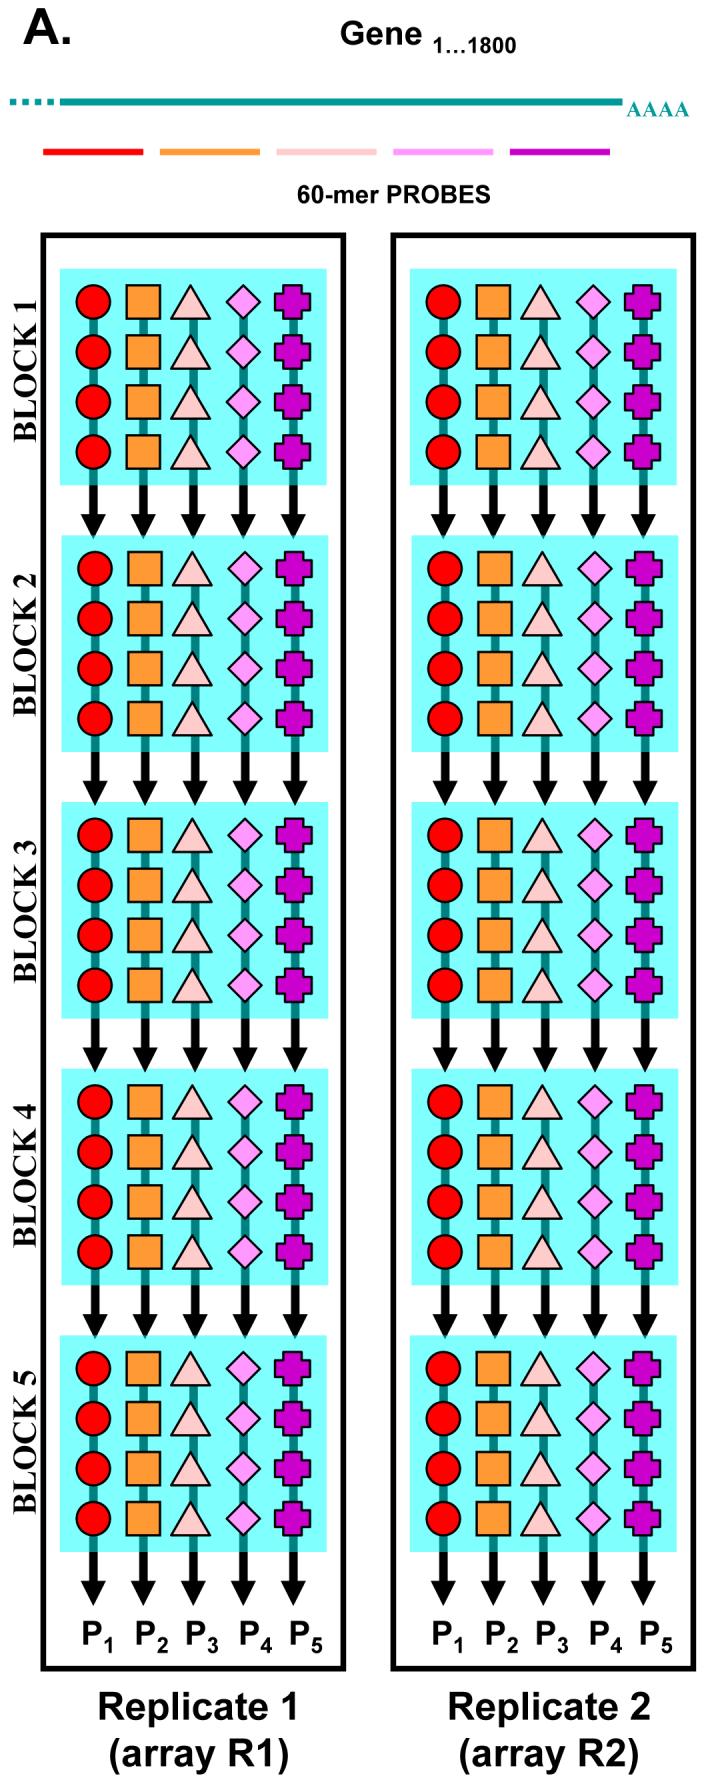
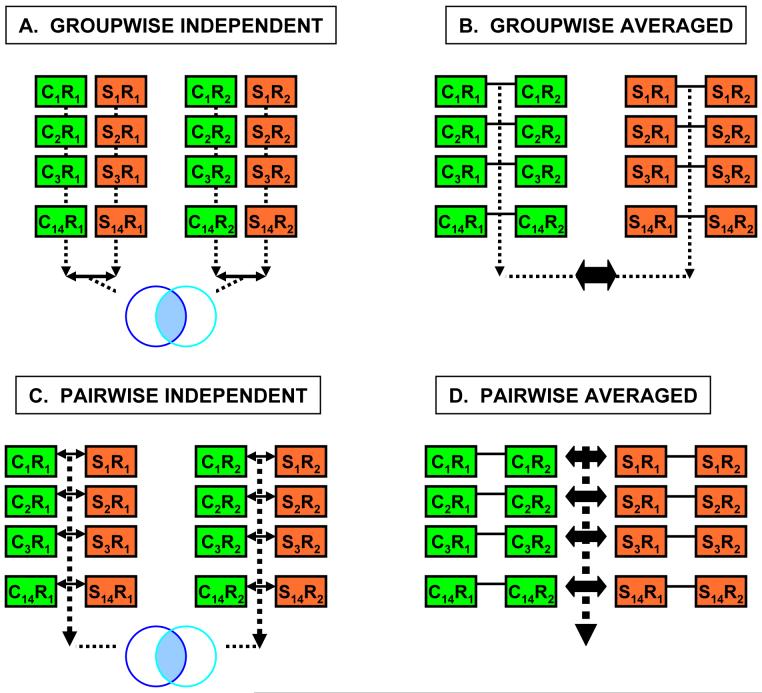
Methods: To increase measurement precision, we used a custom-designed DNA microarray platform with long oligonucleotides and multiple probes with replicates. The platform was designed to assess the expression of > 1800 genes specifically chosen because of their hypothesized roles in the pathophysiology of schizophrenia. The gene expression differences in dorsolateral prefrontal cortex samples from 14 matched pairs of schizophrenia and control subjects were analyzed with two technical replicates and four data mining approaches.

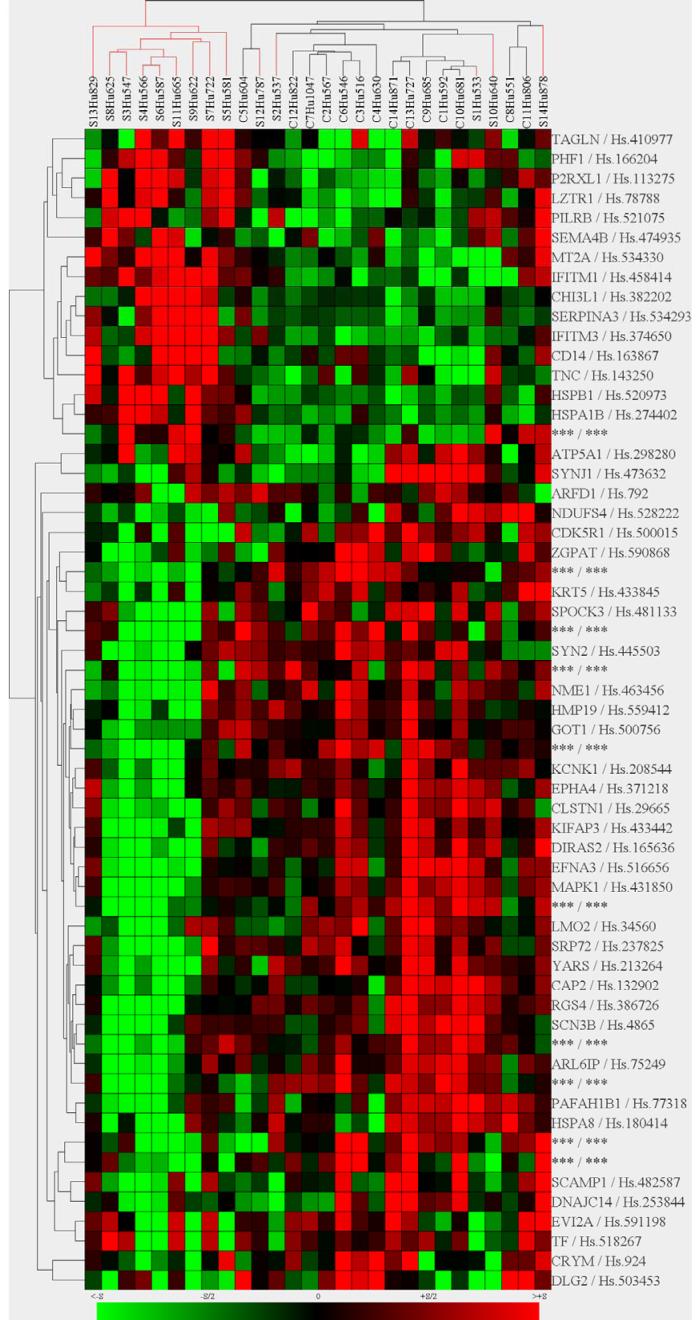
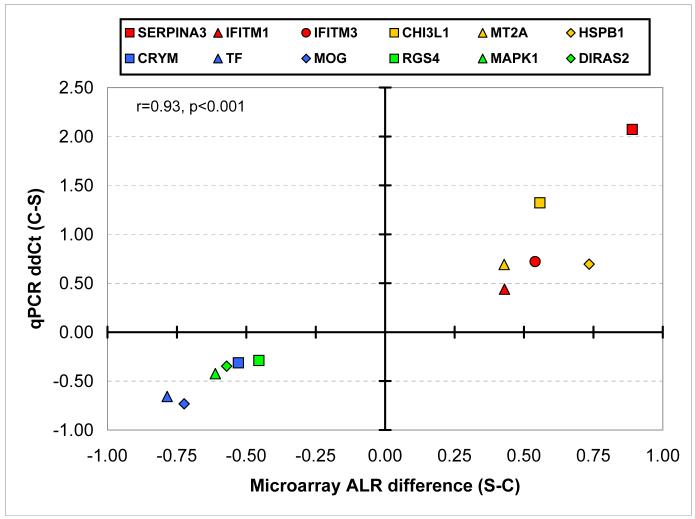
Results: In addition to replicating many expression changes in synaptic, oligodendrocyte, and signal transduction genes, we uncovered and validated a robust immune/chaperone transcript upregulation in the schizophrenia samples.

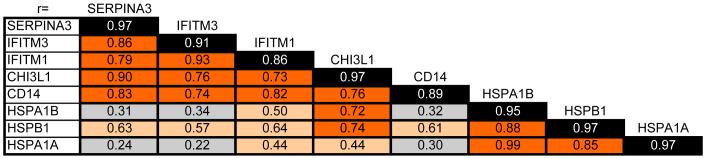
Conclusions: We speculate that the overexpression of SERPINA3, IFITM1, IFITM2, IFITM3, CHI3L1, MT2A, CD14, HSPB1, HSPA1B, and HSPA1A in schizophrenia subjects represents a long-lasting and correlated signature of an early environmental insult during development that actively contributes to the pathophysiology of prefrontal dysfunction.


Figures

Figure 1
Figure 1. DNA microarray design
For each of the >1,800 genes 5 independent, non-overlaping 60-mer DNA probes were designed. Each array contained five identical probe-containing, photolitographically synthesized blocks (sub-arrays). Each block contained 4 probe replicates for each of the 5 probes. Fluorescent intensity values were first averaged within the block, and then across the blocks for each of the 5 probes. This gave rise to 5 intensity values, one for each probe (P1-P5). As the experiment was performed with two replicates, we obtained 10 intensity values for each of the investigated genes (5 for R1 + 5 for R2). These RMA normalized intensities entered the data mining process described in Figure 2.
Figure 2
Figure 2. Data analysis design
A total of four data analysis methods were employed. All 5 probes were treated independently: data across the 5 probes were never combined or averaged. A. In the first approach (groupwise analysis with independent replicates) the data from the first replicate (R1) was compared across schizophrenic (S1-S14) and control subjects (C1-C14). A similar comparison was performed across the second replicate (R2). To be considered a differentially expressed gene, a corresponding microarray probe had to show |ALR| > 0.263 and p > 0.05 in both replicates. B. In the second approach (groupwise analysis with averaged replicates), log2-normalized intensity values were averaged across the two technical replicated originating from a same subjects, and the averaged values were compared in the groupwise fashion between the controls and schizophrenic subjects (|ALR| > 0.263 and p < 0.05). C. In the third approach (pairwise analysis with independent replicates) the 14 matched pairs were compared in a pairwise fashion, generating two ALRs for each of the pairs (one for each technical replicate). Gene probes showing similar expression changes across the R1 and R2 analysis were considered differentially expressed. D. In the fourth approach (pairwise analysis with averaged replicates), the normalized log2 probe intensities were averaged across R1 and R2 for each of the five probes. Then, these average values were compared across the 14 S-C subject pairs in a matched, pairwise fashion.
Figure 3
Figure 3. Hierarchical clustering of gene expression changes
Normalized log2 intensities were clustered by Genes@Work in two dimensions (horizontal-genes; vertical-samples) based on Euclidian distance. Each colored pixel represents a single gene expression value in a single subject. The color intensity is proportional to its relative expression level (green-underexpressed; red-overexpressed). Note that a subset of subjects with schizophrenia (9/14, vertical clustering on the left) shows a commonly altered expression pattern that is distinct from the rest of the schizophrenic and control subjects. ESTs and unannotated probesets were removed from the dataset, while GABA-ergic transcripts are denoted with ***.
Figure 4
Figure 4. qPCR and microarray data are highly correlated
We performed qPCR validation for 12 genes showing robust gene expression differences in the microarray experiments. Validation was performed on 13 of the 14 pairs of matched subjects. Differential S-C microarray expression ALRs are plotted on X axis, while Y axis denotes ΔΔCt in the qPCR experiment. Each symbol corresponds to a single gene. Note that the microarray data are highly correlated with the qPCR data (r=0.93, p < 0.001).
Figure 5
Figure 5. Immune and chaperone transcripts are highly correlated
Microarray data from 5 immune and 3 chaperone genes were examined for correlation across all schizophrenic and control samples. Numbers in black boxes report maximal self-correlation between the 5 different probes for the same gene. Brown boxes denote high correlation (r>0.70), tan boxes suggest moderate (r= 0.40-0.60) while grey boxes correspond to low correlation (r<0.39). Note that IFITM1, IFITM3, SERPINA3, CHI3L1 and CD14 show a very high correlation, and so do the HSP family molecules. However, the correlation between the immune and chaperone molecules was only moderate to weak.

References

    1. Altar CA, Jurata LW, Charles V, et al. Deficient hippocampal neuron expression of proteasome, ubiquitin, and mitochondrial genes in multiple schizophrenia cohorts. Biol Psychiatry. 2005;58:85–96. - PubMed
    1. Ashdown H, Dumont Y, Ng M, Poole S, Boksa P, Luheshi GN. The role of cytokines in mediating effects of prenatal infection on the fetus: implications for schizophrenia. Mol Psychiatry. 2006;11:47–55. - PubMed
    1. Aston C, Jiang L, Sokolov BP. Microarray analysis of postmortem temporal cortex from patients with schizophrenia. J Neurosci Res. 2004;77:858–66. - PubMed
    1. Blalock EM, Chen KC, Sharrow K, et al. Gene microarrays in hippocampal aging: statistical profiling identifies novel processes correlated with cognitive impairment. J Neurosci. 2003;23:3807–19. - PMC - PubMed
    1. Cannon M, Clarke MC. Risk for schizophrenia--broadening the concepts, pushing back the boundaries. Schizophr Res. 2005;79:5–13. - PubMed

Publication types

MeSH terms