. 2007 Aug;14(15):1121-31.
doi: 10.1038/sj.gt.3302980. Epub 2007 Jun 14.

An in vitro model system to study gene therapy in the human inner ear

Affiliations

An in vitro model system to study gene therapy in the human inner ear

B W Kesser et al. Gene Ther. 2007 Aug.

Abstract

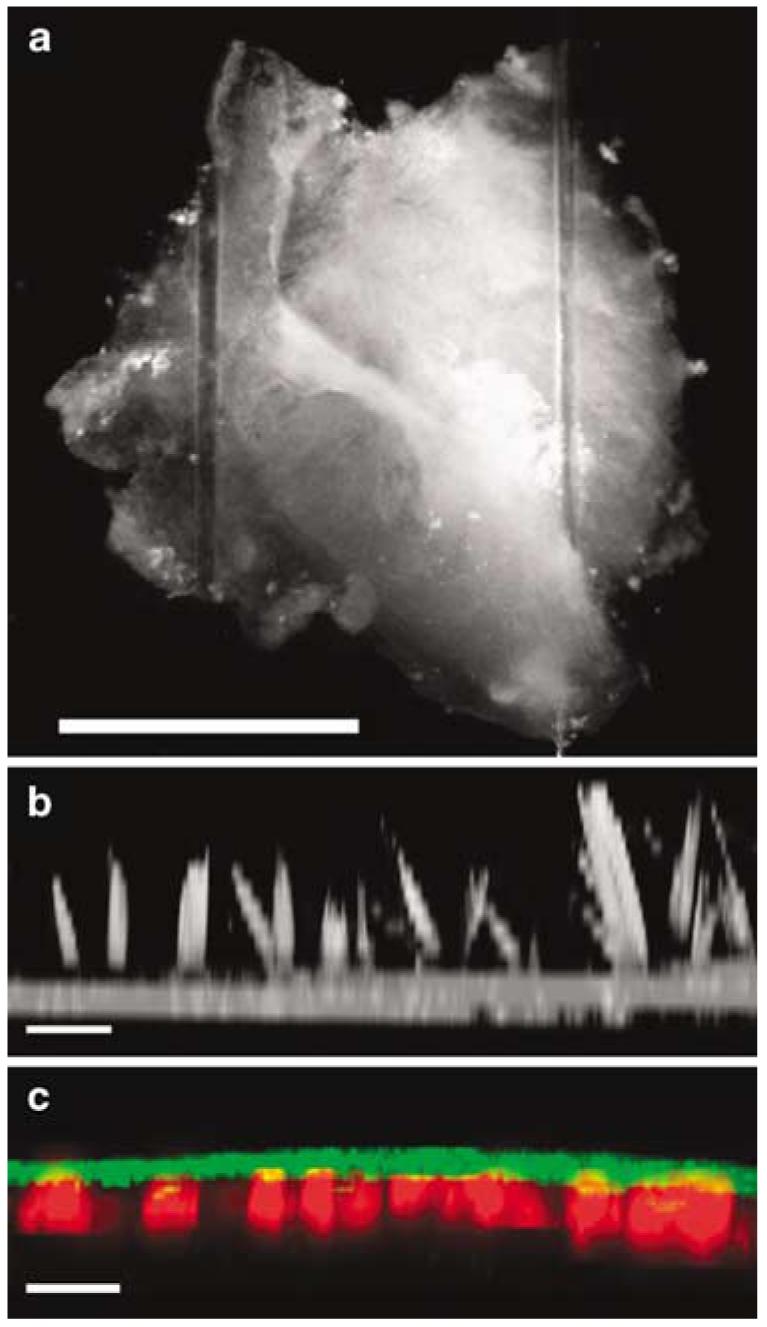
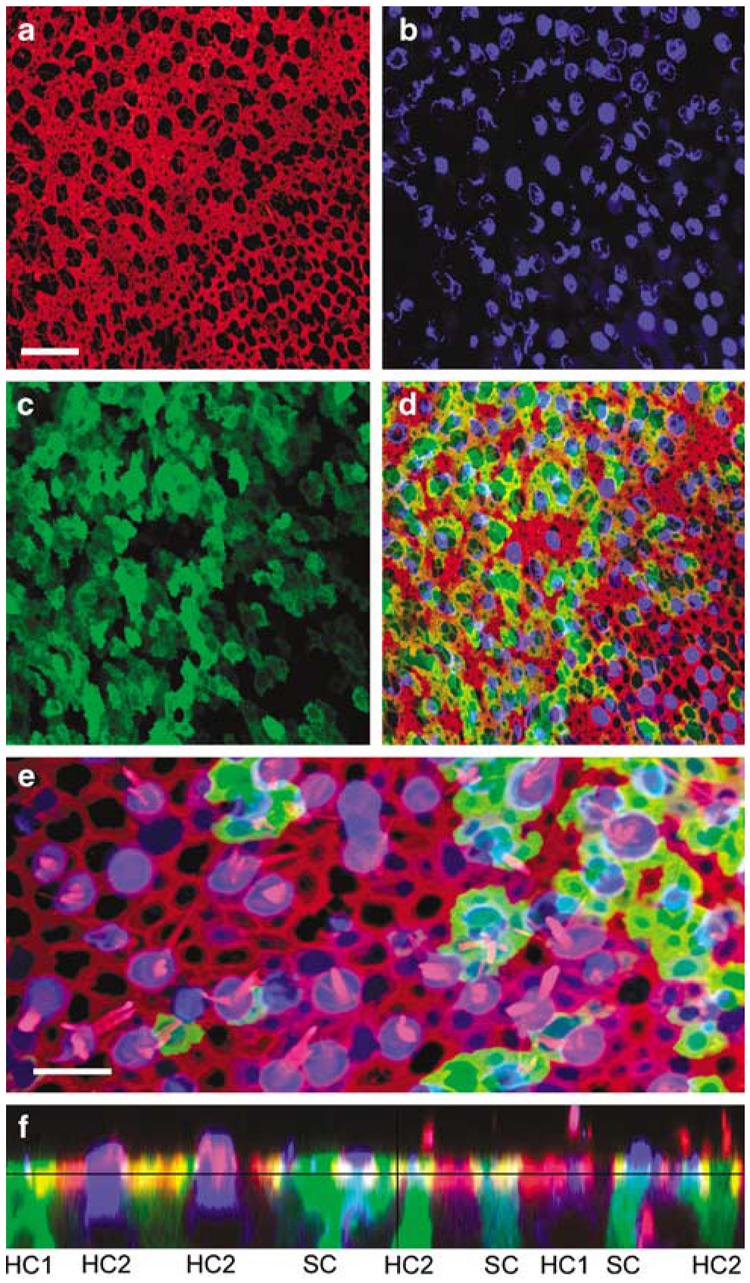
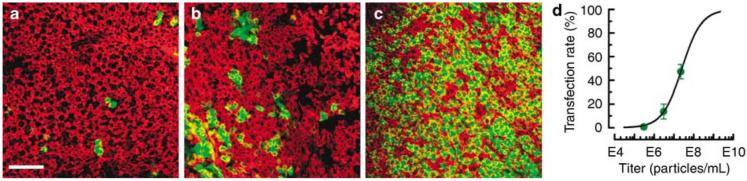
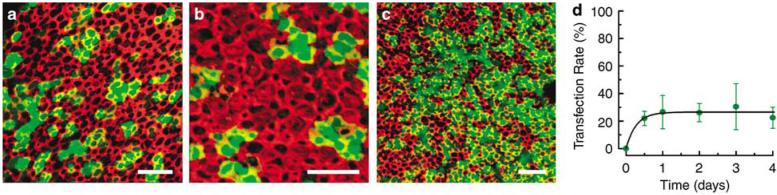
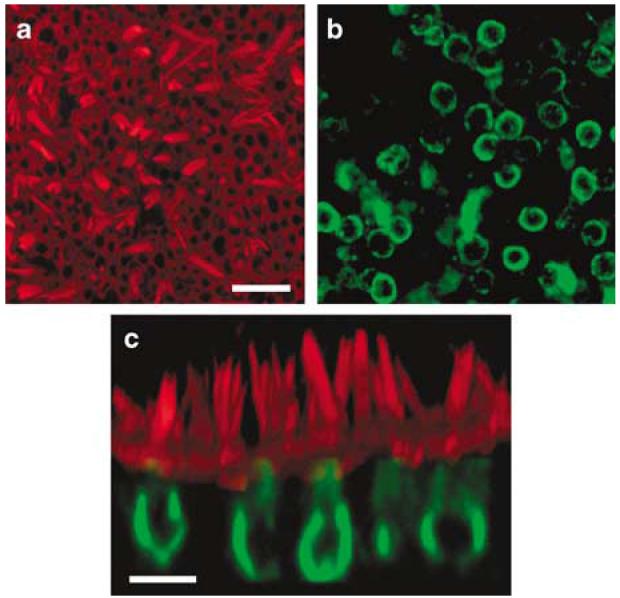
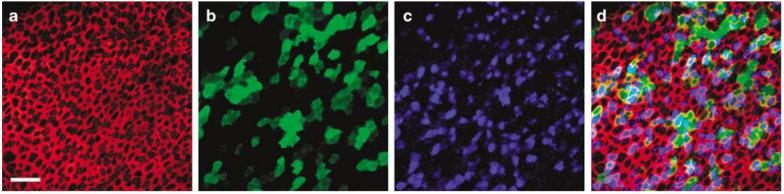
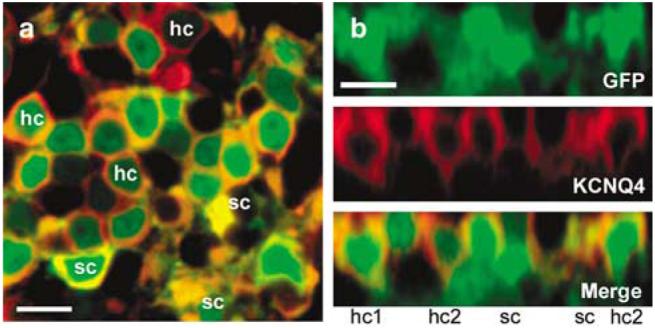
The confined fluid-filled labyrinth of the human inner ear presents an opportunity for introduction of gene therapy reagents designed to treat hearing and balance dysfunction. Here we present a novel model system derived from the sensory epithelia of human vestibular organs and show that the tissue can survive up to 5 days in vitro. We generated organotypic cultures from 26 human sensory epithelia excised at the time of labyrinthectomy for intractable Meniere's disease or vestibular schwannoma. We applied multiply deleted adenoviral vectors at titers between 10(5) and 10(8) viral particles/ml directly to the cultures for 4-24 h and examined the tissue 12-96 h post-transfection. We noted robust expression of the exogenous transgene, green fluorescent protein (GFP), in hair cells and supporting cells suggesting both were targets of adenoviral transfection. We also transfected cultures with a vector that carried the genes for GFP and KCNQ4, a potassium channel subunit that causes dominant-progressive hearing loss when mutated. We noted a positive correlation between GFP fluorescence and KCNQ4 immunolocalization. We conclude that our in vitro model system presents a novel and effective experimental paradigm for evaluation of gene therapy reagents designed to restore cellular function in patients who suffer from inner ear disorders.


Figures

Figure 1
Figure 1
Images of the human vestibular sensory epithelium in vitro. (a) DIC image of a human utricle explant viewed from above the apical surface. The tissue was harvested from the patient and the accessory structures including the nonsensory epithelium, otolithic membrane and otoconia were removed. Just the sensory epithelium was retained and mounted on a glass coverslip, held in place by two glass fibers. Scale bar=1 mm. (b) After 48 h in culture, the tissue was fixed and stained with Alexa Fluor 546-conjugated phalloidin and viewed from above using confocal microscopy. The cross-sectional view was generated from a projection of a stack of 14 image planes, focused at 1.5 μm intervals. Scale bar=10 μm. Note the actin-rich hair bundles that protrude 12–20 μm above the apical surface. (c) The crista harvested from the posterior semicircular canal of patient #9 was cultured for 5 days after which it was fixed, stained with Alexa Fluor 488-conjugated phalloidin (green) and myosin VIIa (red). The tissue was viewed from above and the cross-sectional image was generated from a projection of a stack of 14 image planes. Scale bar=20 μm.
Figure 2
Figure 2
Confocal images of a human utricle harvested from patient #2. The explant was exposed to 107 viral particles/ml of Ad2-GFP for 15 h and maintained in culture for 48 h. The explant was then fixed and stained with Alexa Fluor 546-conjugated phalloidin and an antibody to myosin VIIa and an Alexa Fluor 633-conjugated secondary antibody. Scale bar=20 μm and applies to (a–d) which all show the same image field. (a) A stack of 12 images taken just beneath the apical surface of the epithelium was collapsed to show the cell bodies (b) and the subapical actin (red) that rings each hair cell and supporting cell. (b) Myosin-VIIa immunoreactivity (blue) localizes sensory hair cell cell bodies. (c) Green fluorescence revealed that both hair cells and supporting cells were transfected by the vector and expressed GFP. (d) Merge of panels (a–c). (e) Higher magnification overlay view from a different region of the same epithelium shown in panels (a–d). To generate the image a stack of 13 images focused at the hair bundle level was collapsed (red=actin) and overlaid atop a collapsed stack of 10 images focused at the cell body level from the same image field (blue=myosin VIIa; green=GFP). Scale bar=10 μm. (f) A stack of 19 images projected to reveal a cross-sectional view of the sensory epithelium. Both type I (HC1) and type II hair cells (HC2) and supporting cells were GFP-positive. Myosin VIIa-positive hair cells are also evident. Same color code as for panels (a–e).
Figure 3
Figure 3
Representative confocal images generated from stacks of 12 images taken just beneath the apical surface of human vestibular sensory epithelia excised from patient #5. Tissue was transfected with Ad2-GFP-Q4 at the titer indicated below for 24 h and fixed 72 h post-transfection and stained with Alexa Fluor 546 phalloidin. Each image shows the fluorescence overlay for GFP (green) and actin (red). Scale bar=20 μm and applies to (a–c). (a) Horizontal semicircular canal exposed to 3×10⁵ viral particles/ml. (b) Posterior semicircular canal exposed to 3×10⁶ viral particles/ml. (c) Utricle exposed to 2.3×10⁷ viral particles/ml. (d) Transfection rate was estimated from the number of GFP-positive cells divided by the number of total cells. Each data point was generated by calculating the mean transfection rate from 4 to 5 images taken from a single epithelium. Error bars show s.e.m. (n=4–5). The data were plotted as a function of viral titer (circles) and fitted with a Boltzmann relation that revealed a titer of 2.7×10⁷ viral particles/ml which corresponded to a transfection rate of 50%.
Figure 4
Figure 4
Representative images generated from stacks of confocal images taken just beneath the apical surface of tissue harvested from several patients, exposed to 2.3×10⁷ viral particles/ml of Ad2-GFP-Q4 for 24 h. The explants were maintained in culture as indicated below, fixed and stained with Alexa Fluor 546 phalloidin. Each image shows the fluorescence overlay for GFP (green) and actin (red). The scale bar in each image equals 20 μm. (a) Saccule (patient 7) 1 day post-transfection. (b) Utricle (patient 6) 2 days post-transfection. (c) Utricle (patient 5) 3 days post-transfection. (d) Transfection rate was estimated from the number of GFP-positive cells divided by the number of total cells. The data were plotted as a function of time post-transfection (circles). Error bars show the s.e.m. (n = 2–5). The data were fit with an exponential equation (line) that reached a steady-state transfection rate of 26.5% with a time constant of 6.5 h.
Figure 5
Figure 5
Confocal images of a saccule harvested from patient #1. The explant was cultured for 24 h, fixed and stained with Alexa Fluor 546 phalloidin (red) and endogenous KCNQ4 (green). (a) A view from just above the apical surface of the epithelium reveals the actin-rich hair bundles. Scale bar = 25 μm and applies to panels (a) and (b). (b) An image focused at the cell body level revealed the endogenous pattern of KCNQ4 expression. (c) Cross-sectional projection of the saccule generated from a stack of 43 images focused every 1.0 μm. The actin and KCNQ4 channels were merged. Scale bar = 10 μm.
Figure 6
Figure 6
Stacks of confocal images taken just beneath the apical surface were used to generate images of the saccule harvested from patient #7. The explant culture was exposed to 2.3×10⁷ viral particles/ml of Ad2-GFP-Q4 for 24 h, fixed and stained with Alexa Fluor 546 phalloidin (red) and KCNQ4 (blue) and GFP (green). The scale bar represents 20 μm and applies to all images. The same field and focal planes are shown in images (a–d). (a) An image just beneath the apical surface of the epithelium shows the actin that rings each cell. (b) A total of 103 GFP-positive cells are evident in this field. (c) The KCNQ4 antibody labeled both endogenous hair cell KCNQ4 and exogenous virally expressed KCNQ4. (d) Merge of panels a–c shows colocalization of GFP and KCNQ4 in 78.6% of the cells.
Figure 7
Figure 7
Confocal images of the saccule harvested from patient #7 (same tissue sample shown in Figure 6). The explant culture was exposed to 2.3×10⁷ viral particles/ml of Ad2-GFP-Q4 for 24 h, fixed and stained. (a) A magnified view of a single focal plane 6 μm beneath the apical surface of the saccule. Note that both KCNQ4-positive (red) and green fluorescent protein (GFP)-positive (green) cells with morphologies consistent hair cells and supporting cells are apparent in the image. Hair cell (hc) and supporting cell (sc) morphologies are indicated on the image. Scale bar 10 μm. (b) Cross-sectional projection generated from a stack of 22=images focused every 1.0 μm from the same image field shown in panel (a). Scale bar = 10 μm. Note that both type I (hc1) and type II (hc2) hair cell morphologies are apparent.

Similar articles

Cited by

References

    1. Petit C. From deafness genes to hearing mechanisms: harmony and counterpoint. Trends Mol Med. 2006;12:57–64. - PubMed
    1. Hasson T, Gillespie PG, Garcia JA, MacDonald RB, Zhao Y, Yee AG, et al. Unconventional myosins in inner-ear sensory epithelia. J Cell Biol. 1997;137:1287–1307. - PMC - PubMed
    1. Holt JR. Viral-mediated gene transfer to study the molecular physiology of the mammalian inner ear. Audiol Neurootol. 2002;7:157–160. - PubMed
    1. Corey DP, Garcia-Anoveros J, Holt JR, Kwan KY, Lin SY, Vollrath MA, et al. TRPA1 is a candidate for the mechanosensitive transduction channel of vertebrate hair cells. Nature. 2004;432:723–730. - PubMed
    1. Luebke AE, Steiger JD, Hodges BL, Amalfitano A. A modified adenovirus can transfect cochlear hair cells in vivo without compromising cochlear function. Gene Ther. 2001;8:789–794. - PubMed

Publication types

MeSH terms

Substances