. 2007 Aug 15;583(Pt 1):81-97.
doi: 10.1113/jphysiol.2007.135046. Epub 2007 Jun 14.

Store-operated Ca2+ entry during intracellular Ca2+ release in mammalian skeletal muscle

Affiliations

Store-operated Ca2+ entry during intracellular Ca2+ release in mammalian skeletal muscle

Bradley S Launikonis et al. J Physiol. .

Abstract

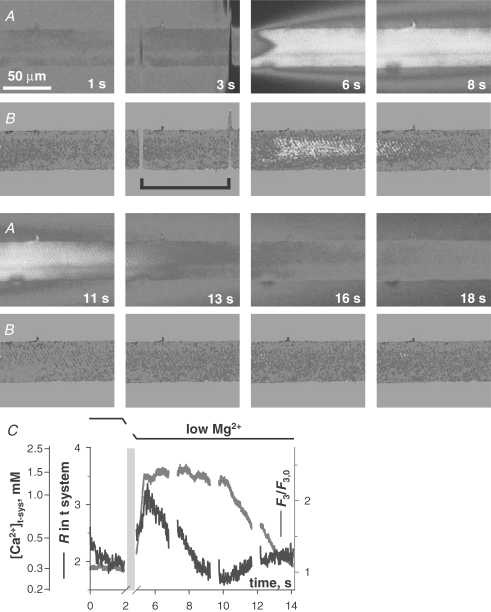
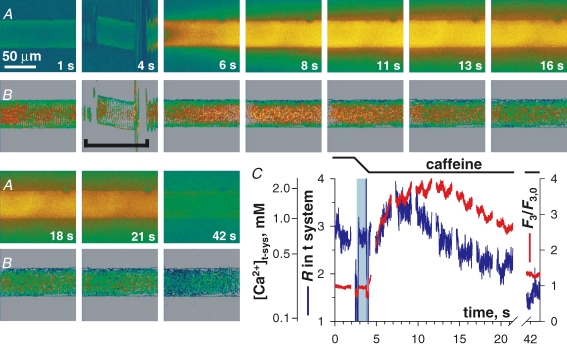
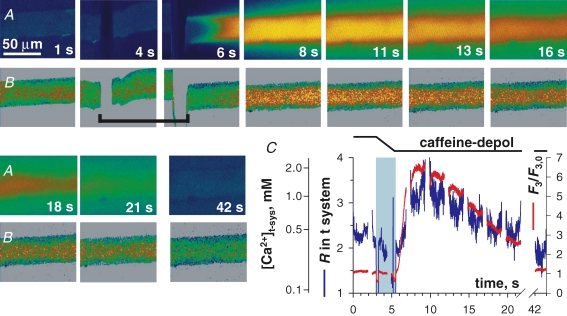
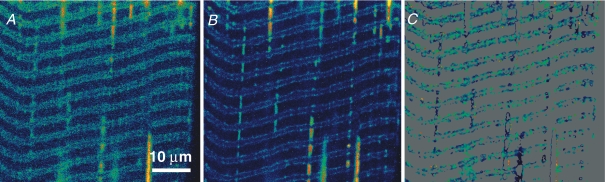
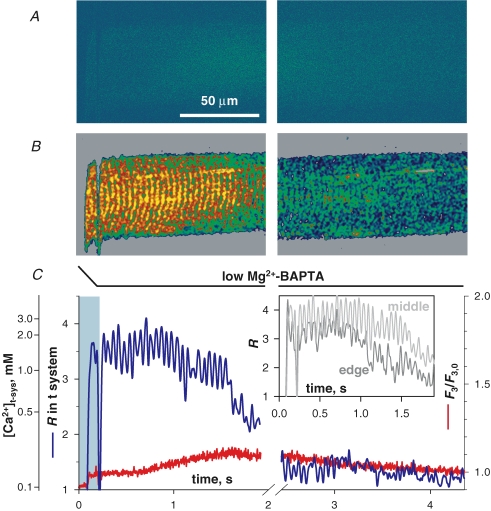
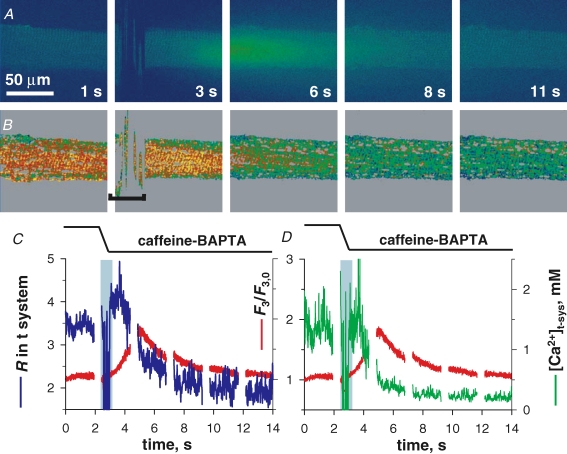
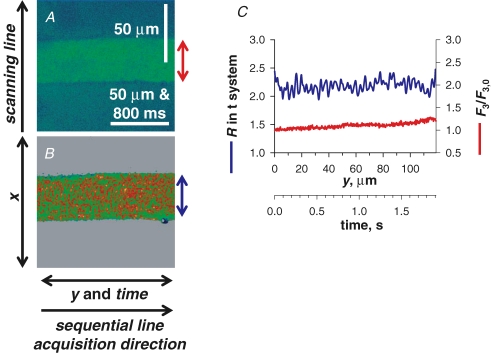
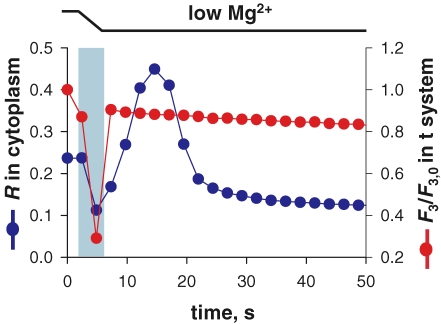
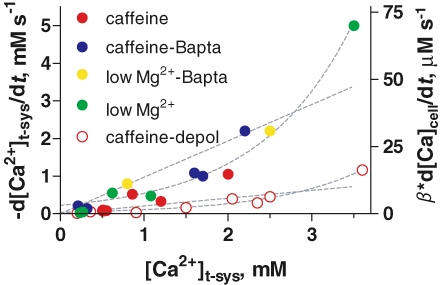
Store-operated Ca2+ entry (SOCE) is activated following the depletion of internal Ca2+ stores in virtually all eukaryotic cells. Shifted excitation and emission ratioing of fluorescence (SEER) was used to image mag-indo-1 trapped in the tubular (t) system of mechanically skinned rat skeletal muscle fibres to measure SOCE during intracellular Ca2+ release. Cytosolic Ca2+ transients were simultaneously imaged using the fluorescence of rhod-2. Spatially and temporally resolved images of t system [Ca2+] ([Ca2+]t-sys) allowed estimation of Ca2+ entry flux from the rate of decay of [Ca2+]t-sys. Ca2+ release was induced pharmacologically to activate SOCE without voltage-dependent contributions to Ca2+ flux. Inward Ca2+ flux was monotonically dependent on the [Ca2+] gradient, and strongly dependent on the transmembrane potential. The activation of SOCE was controlled locally. It could occur without full Ca2+ store depletion and in less than a second after initiation of store depletion. These results indicate that the molecular agonists of SOCE must be evenly distributed throughout the junctional membranes and can activate rapidly. Termination of SOCE required a net increase in [Ca2+]SR. Activation and termination of SOCE are also demonstrated, for the first time, during a single event of Ca2+ release. At the physiological [Ca2+]t-sys, near 2 mM (relative to t system volume), SOCE flux relative to accessible cytoplasmic volume was at least 18.6 microM s(-1), consistent with times of SR refilling of 1-2 min measured in intact muscle fibres.


Figures

Figure 4
Figure 4
SOCE during Ca2+ release and removal A, selected images of fluorescence F3 of cytosolic rhod-2 and B, ratio R of fluorescence images F1 and F2 of mag-indo-1 in the t system, simultaneously acquired while applying the release-inducing low Mg2+ solution. C, spatially averaged values of F3 (normalized by resting value F3,0, red) and R (blue) versus elapsed time (which maps to the abscissa of xy scans as described in Methods). The interval of solution change is indicated by the black bracket in image B at 3 s, and by the light blue bar in C, where fluorescence and ratio plots were omitted during solution change. (ID: 072005b_s013.)
Figure 7
Figure 7
SOCE during complete [Ca2+]SR depletion at resting membrane potential A, images of rhod-2 fluorescence F3 and B, images of mag-indo-1 R in t system, acquired while applying the release-inducing caffeine solution. C, spatially averaged F3/F3,0 (red) and R (blue) versus elapsed time. Other details as in Fig. 4. (ID: 102505e_s010.)
Figure 8
Figure 8
SOCE during complete [Ca2+]SR depletion with a depolarized t system A, F3 and B, R in t system, acquired while applying the release-inducing solution caffeine–depol after transfer from Reference–Na–0 Ca2+, which depolarized the t system. C, spatially averaged F3/F3,0 (red) and R (blue) versus elapsed time. Other details as in Fig. 4. (ID: 092705e_s007.)
Figure 1
Figure 1
SEER imaging of mag-indo-1 inside the sealed t system of a rat skinned fibre A, image of fluorescence F1 (acquired as defined in Methods); B, image F2; C, R =F1/F2, spatially restricted to the two upper quartiles of the dye distribution (Launikonis et al. 2005). Fibre was bathed in low Mg2+. Image-averaged R was 1.82, corresponding to a [Ca2+]t-sys of 0.28 mm. Average dye concentration in the well-stained region was 12.2 μm. (ID: 101805c_#11.)
Figure 5
Figure 5
SOCE with suppressed change in [Ca2+]c A, F3 and B, R in t system, acquired while changing from a solution with 5 mm BAPTA, 0 Ca and 0.65 mm Mg2+ to release-inducing low Mg2+–BAPTA. C, spatially averaged F3/F3,0(red) and R (blue) versus elapsed time, which directly correspond to time and y axis in A and B. Inset, average R in central 40 μm (‘middle') and 30 μm slice starting at the lower edge (‘edge') of the fibre image. Note the periodic pattern of [Ca2+]t-sys in C, which results from the regular placement of t-tubules along the fibre. Other details as in Fig. 4. (ID: 072805f_s012.)
Figure 6
Figure 6
Ca2+ movements following Ca2+ release in caffeine–BAPTA with moderately Ca2+-loaded SR A, F3 and B, R in t system, acquired while changing from a solution with 5 mm BAPTA, 0 Ca and 0.65 mm Mg2+ to releasing-inducing caffeine–BAPTA. C, spatially averaged F3/F3,0(red) and R (blue) versus elapsed time, which directly correspond to time and y axis in A and B. D, spatially averaged F3/F3,0 (red) and [Ca2+]t-sys (green) derived from R in C. Note the abrupt shift in R at the point of introduction of caffeine in the bathing solution. The calibration of R in terms of [Ca2+]t-sys was done using two sets of measured parameters: one for the period without caffeine (before end of blue bar marking solution change), and the other for the period with caffeine (starting at the end of blue bar). Other details as in Fig. 4. (ID: 072805e_s017.)
Figure 2
Figure 2
Image acquisition and analysis A, F3 image. B, simultaneously acquired R in t system. The scanning line was transversal to the fibre axis, x, with each line (512 total) sequentially acquired along the longitudinal axis of the fibre, y. C, spatially averaged values of F3 and R from within the borders of the preparation, as indicated by the double arrows of corresponding colour. Note that y maps proportionally to time. (ID: 072805f_s025_z007.)
Figure 3
Figure 3
Ca2+ release is not associated with a change in volume of the sealed t system Image-averaged fluorescence of cytoplasmic indo-5F (blue) and of fluo-3 trapped in t system (red), versus time. At between 3 and 6 s (light blue bar), the bathing solution was changed from reference to the release-inducing low Mg2+. Fluorescence of fluo-3 in the t system, which presumably corresponds to a fully Ca2+-saturated level, decays throughout at a steady low rate. (ID: 012306a_s008.)
Figure 9
Figure 9
Magnitude of SOCE at different [Ca2+]t-sys and t system membrane potential Symbols plot rate of change of [Ca2+]t-sysversus initial value of [Ca2+]t-sys. Right ordinate axis represents rate of change in terms of total cytosolic Ca2+ concentration. β is the ratio between total and free t system [calcium]. Colours represent different stimuli as indicated, with filled symbols plotting data obtained with a polarized t system and open symbols a depolarized one. Broken lines plot best linear fits passing through the origin or exponential fits. Best fit parameters: slopes of linear regressions were 0.97 ± 0.02 and 0.21 ± 0.01 s−1; and rate constants for exponentials: 0.90 ± 0.05 and 0.92 ± 0.07 s−1, for polarized and depolarized cells, respectively. n = 16 fibres.

Comment in

Similar articles

Cited by

References

    1. Allard B, Couchoux H, Pouvreau S, Jacquemond V. Sarcoplasmic reticulum Ca2+ release and depletion fail to affect sarcolemmal ion channel activity in mouse skeletal muscle. J Physiol. 2006;575:68–81. - PMC - PubMed
    1. Almers W, Fink RHA, Palade PT. Calcium depletion in frog muscle tubules: the decline of calcium current under maintained depolarization. J Physiol. 1981;312:177–207. - PMC - PubMed
    1. Baylor SM, Hollingworth S. Sarcoplasmic reticulum calcium release compared in slow-twitch and fast-twitch fibres of mouse muscle. J Physiol. 2003;551:125–138. - PMC - PubMed
    1. Cheung A, Dantzig JA, Hollingworth S, Baylor SM, Goldman YE, Mitchison TJ, Straight AF. A small-molecule inhibitor of skeletal muscle myosin II. Nat Cell Biol. 2002;4:83–88. - PubMed
    1. Collet C, Ma J. Calcium-dependent facilitation and graded deactivation of store-operated calcium entry in fetal skeletal muscle. Biophys J. 2004;87:268–275. - PMC - PubMed

Publication types

Substances