. 2007 Aug 15;583(Pt 1):115-28.
doi: 10.1113/jphysiol.2007.133413. Epub 2007 Jun 14.

Locomotor rhythmogenesis in the isolated rat spinal cord: a phase-coupled set of symmetrical flexion extension oscillators

Affiliations

Locomotor rhythmogenesis in the isolated rat spinal cord: a phase-coupled set of symmetrical flexion extension oscillators

Laurent Juvin et al. J Physiol. .

Abstract

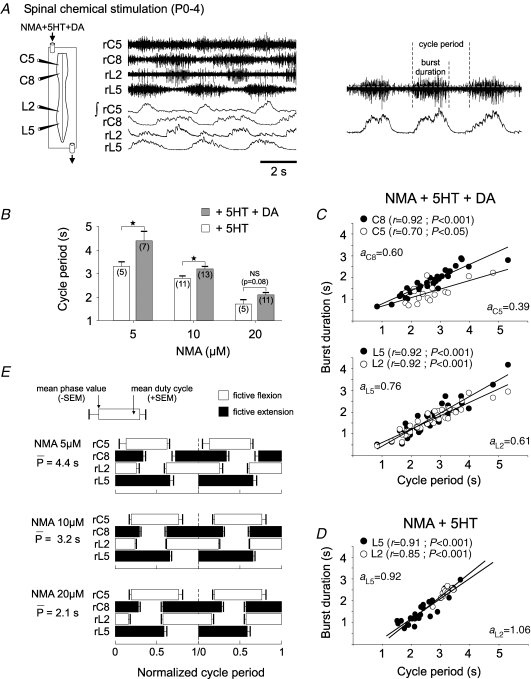
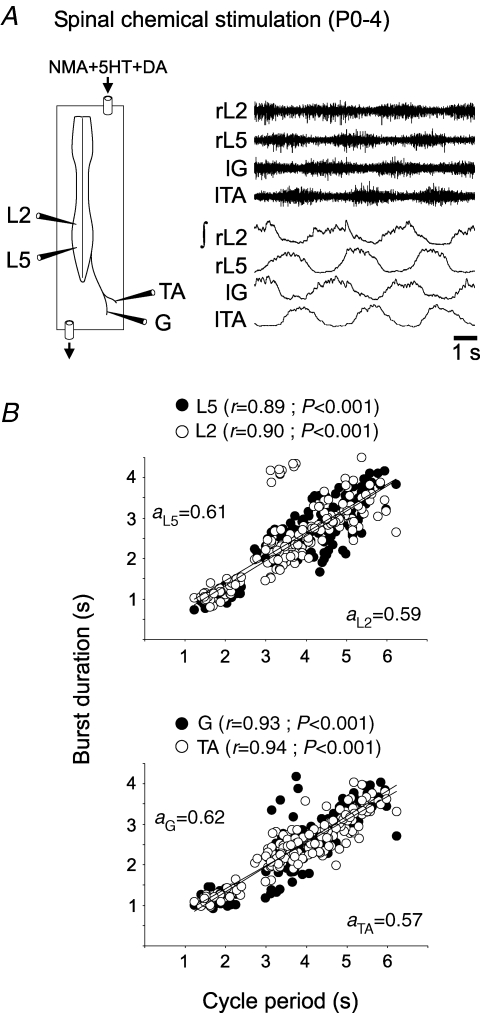
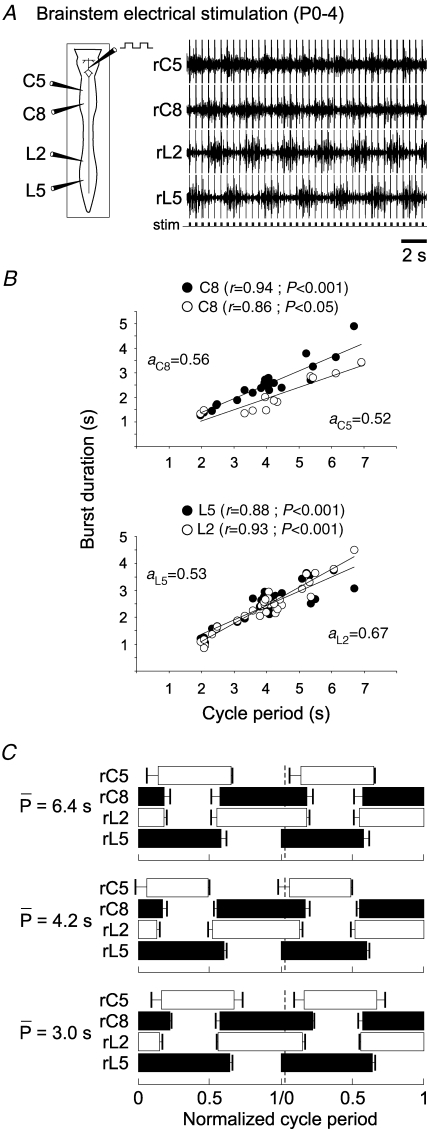
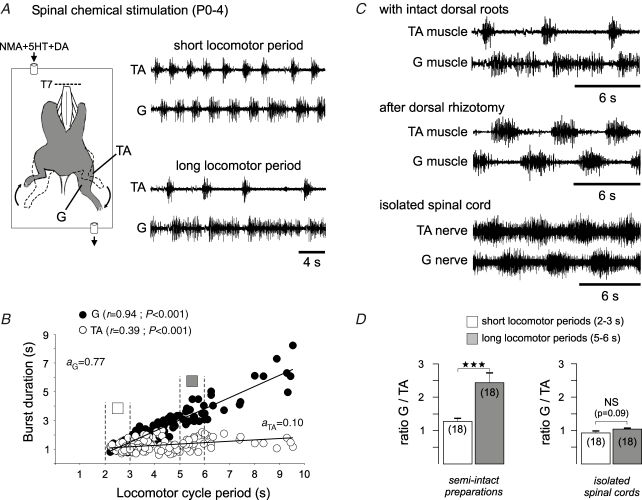
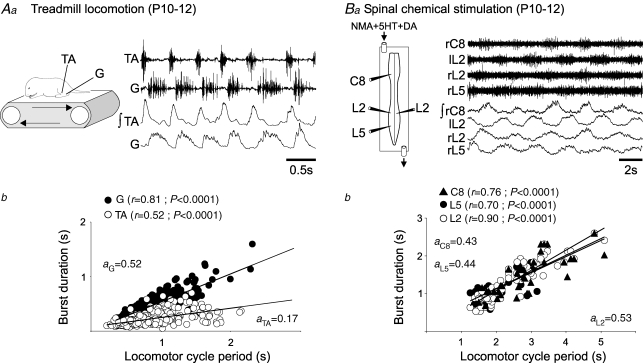
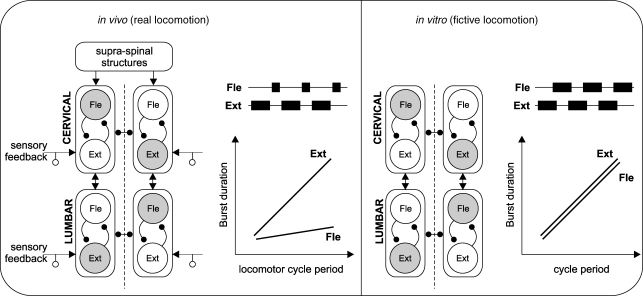
The temporal properties of limb motoneuron bursting underlying quadrupedal locomotion were investigated in isolated spinal cord preparations (without or with brainstem attached) taken from 0 to 4-day-old rats. When activated either with differing combinations of N-methyl-D,L-aspartate, serotonin and dopamine, or by electrical stimulation of the brainstem, the spinal cord generated episodes of fictive locomotion with a constant phase relationship between cervical and lumbar ventral root bursts. Alternation occurred between ipsi- and contra-lateral flexor and extensor motor root bursts, and the cervical and lumbar locomotor networks were always active in a diagonal coordination pattern that corresponded to fictive walking. However, unlike typical locomotion in adult animals in which extensor motoneuron bursts vary more with cycle period than flexor bursts, in the isolated neonatal cord, an increase in fictive locomotor speed was associated with a decrease in the durations of both extensor and flexor bursts, at cervical and lumbar levels. To determine whether this symmetry in flexor/extensor phase durations derived from the absence of sensory feedback that is normally provided from the limbs during intact animal locomotion, EMG recordings were made from hindlimb-attached spinal cords during drug-induced locomotor-like movements. Under these conditions, the duration of extensor muscle bursts increased with cycle period, while flexor burst durations now tended to remain constant. Moreover, after a complete dorsal rhizotomy, this extensor dominant pattern was replaced by flexor and extensor muscle bursts of similar duration. In vivo and in vitro experiments were also conducted on older postnatal (P10-12) rats at an age when body-supported adult-like locomotion occurs. Here again, characteristic extensor-dominated burst patterns observed during intact treadmill locomotion were replaced by symmetrical patterns during fictive locomotion expressed by the chemically activated isolated spinal cord, further indicating that sensory inputs are normally responsible for imposing extensor biasing on otherwise symmetrically alternating extensor/flexor oscillators.


Figures

Figure 1
Figure 1
Motor pattern generation for fictive quadrupedal stepping in neonatal rat (P0–4) spinal cord A, left, schematic of isolated spinal cord with extracellular recording locations from right (r) cervical (flexor, C5; extensor, C8) and lumbar (flexor, L2; extensor, L5) ventral roots; right, raw extracellular and corresponding integrated (∫) activity during fictive locomotion evoked by bath-application of N-methyl-d,l-aspartate (NMA; 10 μm), serotonin (5HT; 10 μm) and dopamine (DA; 100 μm). B, relationship between cycle period of chemically induced rhythmicity and the concentration (5, 10 or 20 μm) of NMA used with 5HT alone (open bars), or with 5HT + DA (shaded bars). Vertical lines indicate s.e.m. and numbers of measured preparations for each condition are indicated in parentheses. *P< 0.05; NS, difference not significant. C, scatter plots showing the relationship between homolateral lumbar (lower) and cervical (upper) burst durations and rhythm cycle period. Data were pooled from 13 preparations. Each point represents the mean burst duration for at least 20 cycles of the same duration from a single preparation. A given preparation can be represented by up to three points. Both flexor (L2, C5; ○) and extensor (L5, C8; •) burst durations were positively correlated with cycle period. D, similar dependence of lumbar flexor and extensor burst durations on cycle period in preparations activated with NMA and 5HT alone. Data were pooled from 11 preparations, with measurements made as in C. Each line in C and D is the linear regression for the corresponding pool of flexor and extensor bursts. The coefficients (r) and slopes (a) of the regression lines are indicated. E, phase diagrams showing two normalized cycles of fictive locomotion under different NMA concentrations (top, 5 μm; middle, 10 μm; bottom, 20 μm) and with 5HT and DA constant at 10 and 100 μm, respectively. Cycles were normalized to the onset of consecutive bursts of activity in the L5 ventral root. Despite differences in mean cycle period, the phase relationships in all three cases remained constant and corresponded to fictive walking.
Figure 2
Figure 2
Correspondence between locomotor-related bursting recorded from lumbar ventral roots and identified peripheral limb nerves A, experimental preparation (left) showing recording positions from right lumbar roots (rL2 and rL5), and the left tibialis anterior (lTA) and gastrocnemius (lG) nerve branches, and locomotor-related activity (raw and integrated traces at right) induced by a mixture of NMA (10 μm), 5HT (10 μm) and DA (100 μm). B, scatter plots of burst duration versus cycle period for flexor (L2) and extensor (L5) ventral root activity (upper), and flexor (TA) and extensor (G) peripheral nerve activity (lower). Note the close similarity in the relations between burst and cycle duration at the two recording levels. Data were pooled from five preparations, with each point representing the burst–cycle duration ratio for a single cycle. r and a are the coefficient and slope, respectively, of the corresponding regression line.
Figure 3
Figure 3
Brainstem electrical stimulation also induces phase-locked fictive locomotion in the isolated P0–4 spinal cord A, schematic of brainstem/spinal cord preparation (left) and extracellular recordings (right) from homolateral cervical (C5, C8) and lumbar (L2, L5) ventral roots during electrical stimulation (stim; lower trace) of the ventral surface of the brainstem. B, flexor/extensor burst durations at lumbar (lower plots) and cervical (upper plots) levels as a function of rhythm cycle period. Each point represents the mean burst duration for at least 20 cycles in a single preparation. The data set was obtained from 11 preparations, with a given preparation being represented by up to three points. r, coefficient of regression line; a, slope of regression line. C, phase diagrams showing two normalized fictive step cycles during electrically evoked fictive locomotion. Cycles were normalized to burst onset in right L5. To test for cycle period-dependent changes in phase relationships, bursts were divided into arbitrarily defined cycle period groups (means (P) of 6.4, 4.2 and 3.0 s) and their phase diagrams were constructed separately.
Figure 4
Figure 4
Extensor-phase-dominated locomotor burst patterns in P0–4 semi-isolated preparations A, schematic of hindlimb-attached spinal cord preparation (left) and EMG recordings (raw traces; right) from homolateral tibialis anterior (TA) and gastrocnemius (G) muscles during chemically induced rhythmic locomotor movements (NMA, 5–20 μm; 5HT, 10 μm; DA, 100 μm). The spinal cord was sectioned at the thoracic (T7) level (dotted line). B, scatter plots showing asymmetrical relationships between the flexor (TA, ○) and extensor (G, •) burst durations and cycle period. Data were pooled from five preparations and each point represents the burst–cycle duration ratio for a single cycle period. r, coefficient of regression line; a, slope of regression line. Note that squares correspond to the data sets (between dotted lines) used to calculate D. C, G and TA muscle activities during pharmacologically induced locomotion in a hindlimb-attached preparation before (upper traces) and after a complete dorsal rhizotomy (middle traces). The symmetrical locomotor pattern observed in this deafferented semi-intact preparation was similar to that recorded from G and TA nerve branches in a different completely isolated spinal cord (lower panel). D, ratio between burst durations in the G and TA muscles (left) and in their nerves (right) for arbitrarily defined ‘short’ (open bars) and ‘long’ (shaded bars) locomotor cycle periods in semi-intact (left) and isolated spinal cord (right) preparations. Vertical lines indicate s.e.m. and the numbers of cycles used for each experimental condition are indicated in parentheses. Note that data illustrated in D were obtained from two different groups of animals (five semi-intact preparations, and five isolated spinal cords as in Fig. 2B, lower). ***P< 0.001; NS, not significant.
Figure 5
Figure 5
Real and fictive locomotion in 10- to 12-day-old rats Aa, treadmill locomotion of intact animal (see schematic, left) during EMG recordings from the flexor tibialis anterior (TA) and extensor gastrocnemius (G) muscles of the same hindlimb. Ba, chemically induced fictive locomotion in the isolated spinal cord as recorded from cervical (C8) and lumbar (left/right L2 and L5) ventral roots. NMA, 5HT and DA were bath-applied at 10, 10 and 100 μm, respectively. Ab and Bb, scatter plots showing relationships between the duration of flexor (○) and extensor activity (•) and real (Ab) or fictive (Bb) locomotor cycle period. In both cases, each point represents the mean burst duration for ≥10 cycles of the same duration in a single preparation. Note that the apparent lack of paired data points in each plot is due to a superposition (and masking) of identical burst duration/cycle period values. Data sets in Ab and Bb were obtained from five and three animals, respectively. r, coefficient of regression line; a, slope of regression line.
Figure 6
Figure 6
Schematic representation of locomotor circuitry responsible for flexor (Fle) and extensor (Ext) burst activity during real (in vivo) and fictive (in vitro) quadrupedal locomotion Shaded circles denote coincident flexor/extensor activity at bilateral cervical (C5, C8) and lumbar (L2, L5) levels. Note left–right and homolateral flexor–extensor alternation that corresponds to a walking gait. In the intact stepping animal (left panel) with brainstem descending pathways and movement-derived sensory input from the limbs, the step cycle is dominated by extensor muscle activity, the duration of which is positively correlated with the cycle period, while flexor activity changes much less. In the isolated cord, however (right panel), descending and sensory inputs are absent and the fictive locomotor pattern now consists of symmetrical flexor–extensor alternation, with bursts in both phases displaying a positive correlation with cycle duration. See Discussion for further explanation.

Similar articles

Cited by

References

    1. Armstrong DM. The supraspinal control of mammalian locomotion. J Physiol. 1988;405:1–37. - PMC - PubMed
    1. Atsuta Y, Garcia-Rill E, Skinner RD. Electrically induced locomotion in the in vitro brainstem–spinal cord preparation. Brain Res. 1988;470:309–312. - PubMed
    1. Baker LL, Chandler SH, Goldberg LJ. l-dopa-induced locomotor-like activity in ankle flexor and extensor nerves of chronic and acute spinal cats. Exp Neurol. 1984;86:515–526. - PubMed
    1. Ballion B, Morin D, Viala D. Forelimb locomotor generators and quadrupedal locomotion in the neonatal rat. Eur J Neurosci. 2001;14:1727–1738. - PubMed
    1. Barbeau H, Rossignol S. Recovery of locomotion after chronic spinalization in the adult cat. Brain Res. 1987;412:84–95. - PubMed

Publication types

MeSH terms

LinkOut - more resources