. 2007 Sep;148(9):4318-33.
doi: 10.1210/en.2007-0161. Epub 2007 Jun 14.

Sex-dependent metabolic, neuroendocrine, and cognitive responses to dietary energy restriction and excess

Affiliations

Sex-dependent metabolic, neuroendocrine, and cognitive responses to dietary energy restriction and excess

Bronwen Martin et al. Endocrinology. 2007 Sep.

Abstract

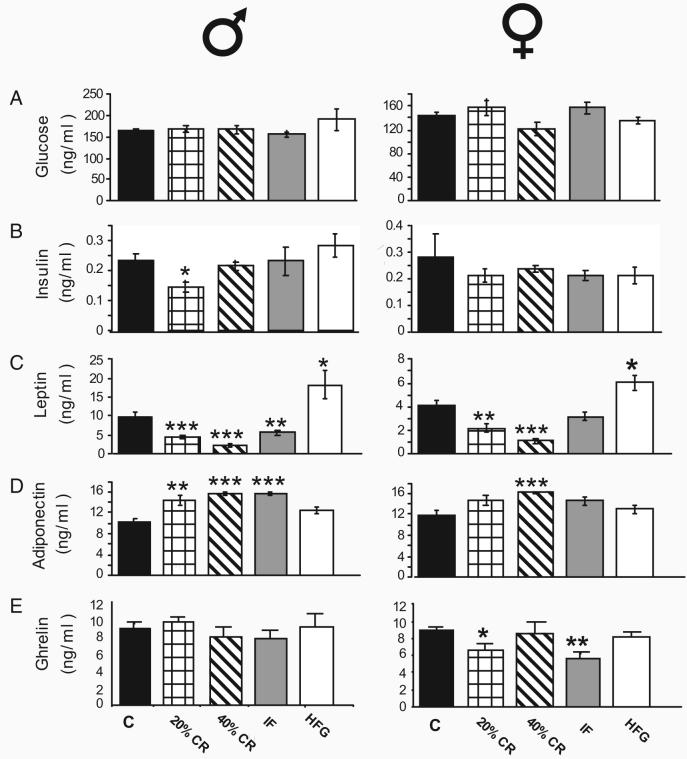
Females and males typically play different roles in survival of the species and would be expected to respond differently to food scarcity or excess. To elucidate the physiological basis of sex differences in responses to energy intake, we maintained groups of male and female rats for 6 months on diets with usual, reduced [20% and 40% caloric restriction (CR), and intermittent fasting (IF)], or elevated (high-fat/high-glucose) energy levels and measured multiple physiological variables related to reproduction, energy metabolism, and behavior. In response to 40% CR, females became emaciated, ceased cycling, underwent endocrine masculinization, exhibited a heightened stress response, increased their spontaneous activity, improved their learning and memory, and maintained elevated levels of circulating brain-derived neurotrophic factor. In contrast, males on 40% CR maintained a higher body weight than the 40% CR females and did not change their activity levels as significantly as the 40% CR females. Additionally, there was no significant change in the cognitive ability of the males on the 40% CR diet. Males and females exhibited similar responses of circulating lipids (cholesterols/triglycerides) and energy-regulating hormones (insulin, leptin, adiponectin, ghrelin) to energy restriction, with the changes being quantitatively greater in males. The high-fat/high-glucose diet had no significant effects on most variables measured but adversely affected the reproductive cycle in females. Heightened cognition and motor activity, combined with reproductive shutdown, in females may maximize the probability of their survival during periods of energy scarcity and may be an evolutionary basis for the vulnerability of women to anorexia nervosa.


Figures

Fig. 1
Fig. 1
Configurations of the straight runway used for premaze training and the 14-unit T-maze used for testing learning and memory. Arrows denote the correct pathway. Errors are recorded as any deviation from this pathway.
Fig. 2
Fig. 2
Experimental design, diet composition, and body weight responses to energy restriction and excess. The experimental timeline for this study is displayed at the top of the figure. A and B, Relative proportions of the major nutritional groups in the control (A) and HFG diet (B) applied to male and female rats for 6 months. Panels C–E are segregated according to male (left) and female (right) denoted by the gender symbols above each series of panels. This notation is retained throughout other figures in the manuscript. C, Body weights of male and female rats in the different diet groups. All of the dietary manipulations resulted in a sustained statistically significant (P < 0.05) difference in the male animals' weight, compared with control after 2 wk of implementation. The 20% CR, 40% CR, and IF females demonstrated significant (P < 0.05) weight deviation from the control group after 3 wk. The female HFG group failed to show a sustained statistical difference to control until wk 20. D and E, The amounts of food (D) and calories (E) consumed by each group of rats. Values are the mean ± sem for 15 rats in the control diet group and eight rats in each of the other diet groups.
Fig. 3
Fig. 3
Dietary energy restriction disrupts reproductive physiology in females. Panel A, The ability of female Sprague Dawley rats to perform a 4-d estrous cycle was assessed in the presence of the four dietary alteration paradigms. Irregular estrous cycling represents cycles with between 1 and 3 altered days in the pattern. Nonestrous cycle animals displayed no regularity during their typical 4-d cycle. Percentage distribution of animal numbers per cycling group are represented. Statistical significance of the relative values were calculated relative to the control proportions using a Student's t test. Panels B–D, Plasma levels of estradiol (panel B), testosterone (panel C), and corticosterone (panel D) in male and female rats that had been maintained on the indicated diets. C, Control. *, P < 0.05; **, P < 0.01; ***, P < 0.001.
Fig. 4
Fig. 4
Dietary energy intake modifies plasma lipid levels similarly in males and females. Each bar (panels A–E) represents the mean ± sem lipid/lipid-metabolite/lipoprotein level for the control, 20% CR, 40% CR, IF, and HFG diet. Control animal data are represented by black bars, 20% CR animals by boxed bars, 40% CR animals by striped bars, IF animals by gray bars, and HFG animals by white bars. This notation and its position in the figure is continued throughout the remaining figures in the manuscript. Panel A, Circulating cholesterol concentration. Panel B, Circulating triglyceride. Panel C, Circulating LDL. Panel D, HDL. Panel E, 3-Hydroxybutyrate (3-HB). Statistical significance, compared with control animals, was estimated using a non-paired Student's t test (n = 8–15 rats/group). C, Control. *, P < 0.05; **, P < 0.01; ***, P < 0.001.
Fig. 5
Fig. 5
Some energy-regulating hormones are differentially affected by dietary energy restriction in males and females. Plasma levels of glucose (panel A), insulin (panel B), leptin (panel C), adiponectin (panel D), and ghrelin (panel E) were measured in male and female rats that had been maintained for 6 months on the indicated diets. Values are the mean ± sem. C, Control. *, P < 0.05; **, P < 0.01; ***, P < 0.001, compared with the control value.
Fig. 6
Fig. 6
Sex-dependent effects of dietary energy restriction on plasma GH levels. Plasma prolactin (panel A) and GH (panel B) levels in male and female rats that had been maintained for 6 months on the indicated diets. Values are the mean ± sem (n = 8–15 rats/group). C, Control. *, P < 0.05; **, P < 0.01, compared with the control value.
Fig. 7
Fig. 7
Active avoidance trials (for premaze testing) and shock time and shock frequency in the 14-unit T-maze. Panel A, Results of active avoidance trials. The times of male (M) and female (F) rats that had been maintained on the indicated diets to escape from a foot shock administered up to 25 successive times are shown. Panels B and C, Shock frequencies (panel B) and shock times (panel C) for individual trials of male and female rats in the acquisition phase of the 14-unit maze test. Panels D and E, Shock frequencies (panel D) and shock times (panel E) for individual trials of male and female rats in the retention phase of the 14-unit maze test. Values are mean ± sem (n = 8–15 rats/group). C, Control.
Fig. 8
Fig. 8
Dietary energy restriction improves performance of female, but not male, rats in a 14-unit T-maze cognitive test. Acquisition errors (panel A), acquisition times (panel B), retention errors (panel C), and retention times (panel D) of male and female rats that had been maintained for 5 months on the indicated diets. Values are the mean ± sem (n = 8–15 rats/group). C, Control. *, P < 0.05; **, P < 0.01.
Fig. 9
Fig. 9
Dietary energy restriction and excess differentially modify levels of brain-derived neurotrophic factor in the brains and plasma of male and female rats. BDNF levels in the hippocampus (panel A), cerebral cortex (panel B), and plasma (panel C) of male and female rats that had been maintained for 6 months on the indicated diets. Values are mean ± sem (n = 8–15 rats/group). C, Control. *, P < 0.05; **, P < 0.01, compared with the control value.

References

    1. Levine A, Billington C. Why do we eat? A neural systems approach. Annu Rev Nutr. 1997;17:597–619. - PubMed
    1. Badman M, Flier J. The gut and energy balance: visceral allies in the obesity wars. Science. 2005;307:1909–1914. - PubMed
    1. Volkow N, Wise R. How can drug addiction help us understand obesity? Nat Neurosci. 2005;8:555–560. - PubMed
    1. Haslam D, James W. Obesity. Lancet. 2005;366:1197–1209. - PubMed
    1. Sohal R, Weindruch R. Oxidative stress, caloric restriction, and aging. Science. 1996;273:59–63. - PMC - PubMed

Publication types