

Diffusion anisotropy measurement of brain white matter is affected by voxel size: underestimation occurs in areas with crossing fibers
- PMID: 17569968
- PMCID: PMC8134156
- DOI: 10.3174/ajnr.A0488
Diffusion anisotropy measurement of brain white matter is affected by voxel size: underestimation occurs in areas with crossing fibers
Abstract
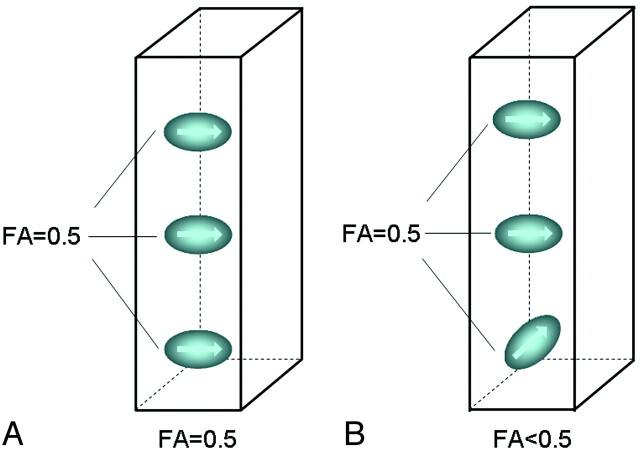
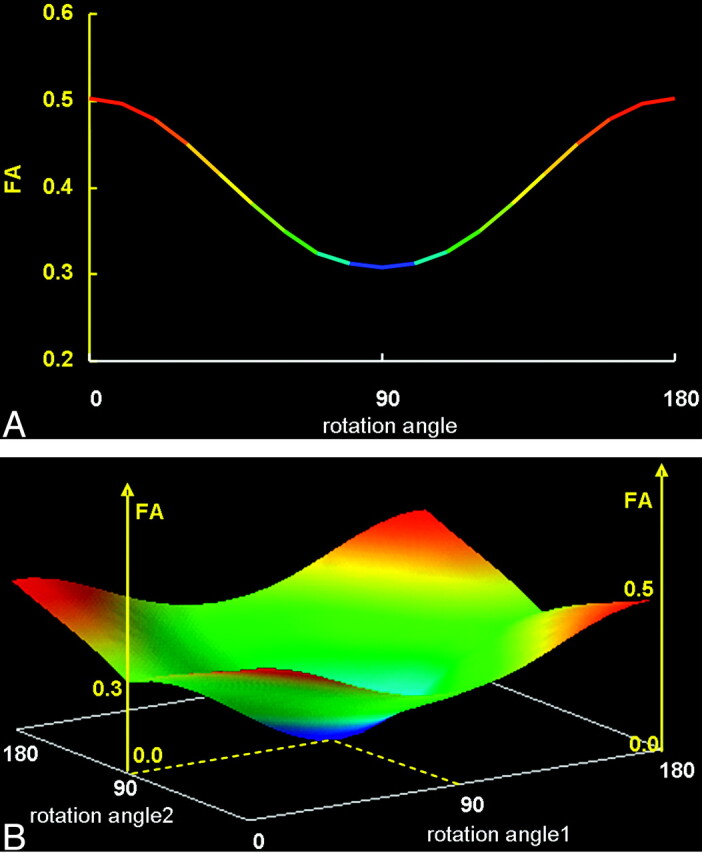
Background and purpose: Voxel size/shape of diffusion tensor imaging (DTI) may directly affect the measurement of fractional anisotropy (FA) in regions where there are crossing fibers. The purpose of this article was to investigate the effect of voxel size/shape on measured FA by using isotropic and nonisotropic voxels.
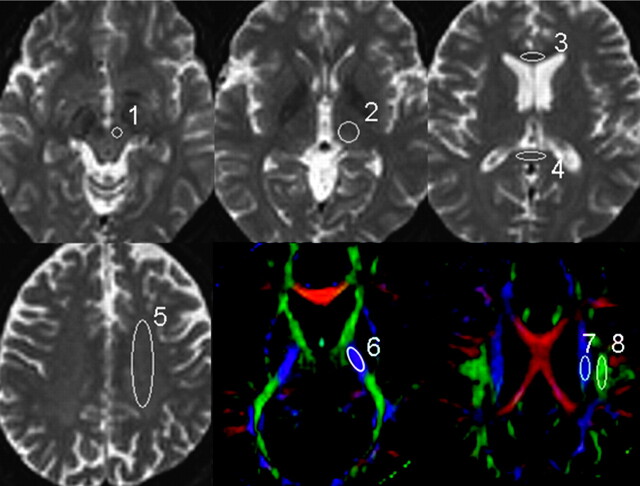
Materials and methods: Ten healthy adult volunteers had MR imaging by using a 1.5 T clinical imager. DTI was performed with 2 different voxel sizes: a 2-mm-section isotropic voxel (2 x 2 x 2 mm(3)) and a 6-mm-section nonisotropic voxel (2 x 2 x 6 mm(3)). Images were obtained by using a single-shot echo-planar imaging technique with motion-probing gradients in 15 orientations and a b-value of 1000 s/mm(2). FA and the apparent diffusion coefficient (ADC) were measured at different sites of the brain.
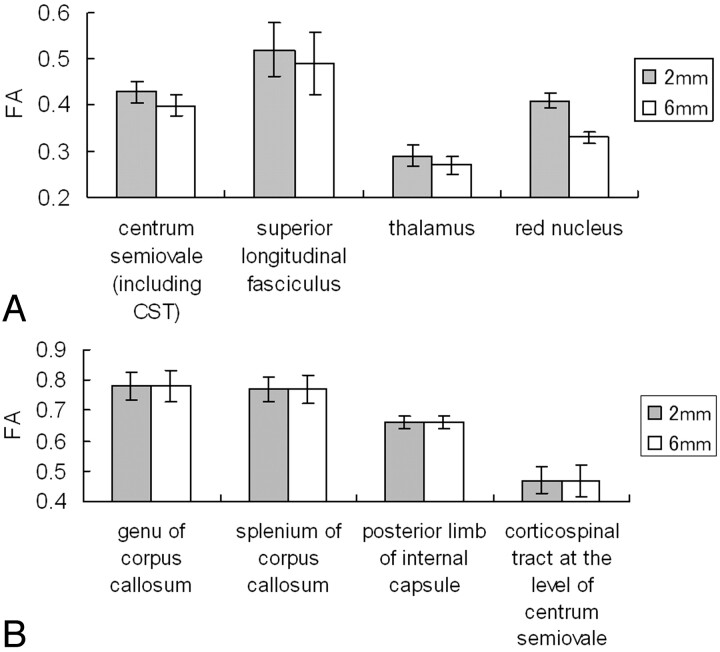
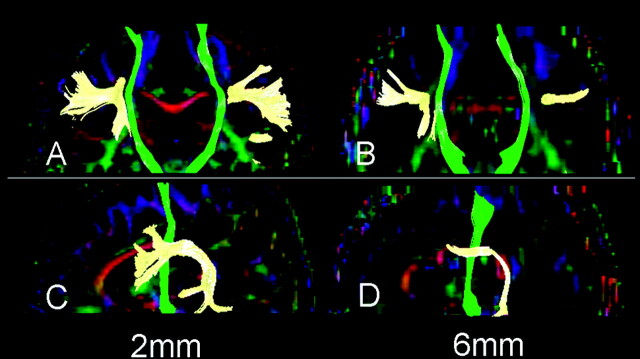
Results: When smaller isotropic voxels were used, the FA was greater in areas with crossing fibers, including the superior longitudinal fasciculus, the thalamus, and the red nucleus; the FA was not significantly different in areas without crossing fibers, such as the corpus callosum, the posterior limb of the internal capsule, and the corticospinal tract at the level of the centrum semiovale (P>.05). The ADC values were not affected by voxel size/shape at any of the areas of the brain that were measured.
Conclusion: FA values that are measured in regions containing crossing fibers are underestimated when using nonisotropic DTI.
Figures

Similar articles
-
Intersubject variability in the analysis of diffusion tensor images at the group level: fractional anisotropy mapping and fiber tracking techniques.Magn Reson Imaging. 2009 Apr;27(3):324-34. doi: 10.1016/j.mri.2008.07.003. Epub 2008 Aug 12. Magn Reson Imaging. 2009. PMID: 18701228
-
Statistical representation of mean diffusivity and fractional anisotropy brain maps of normal subjects.J Magn Reson Imaging. 2006 Dec;24(6):1243-51. doi: 10.1002/jmri.20745. J Magn Reson Imaging. 2006. PMID: 17083103
-
Sex dimorphism in the white matter: fractional anisotropy and brain size.J Magn Reson Imaging. 2014 Apr;39(4):917-23. doi: 10.1002/jmri.24225. Epub 2013 Oct 7. J Magn Reson Imaging. 2014. PMID: 24123288
-
The role of diffusion tensor imaging and fractional anisotropy in the evaluation of patients with idiopathic normal pressure hydrocephalus: a literature review.Neurosurg Focus. 2016 Sep;41(3):E12. doi: 10.3171/2016.6.FOCUS16192. Neurosurg Focus. 2016. PMID: 27581308 Review.
-
Diffusion tensor MR imaging and fiber tractography: technical considerations.AJNR Am J Neuroradiol. 2008 May;29(5):843-52. doi: 10.3174/ajnr.A1052. Epub 2008 Mar 13. AJNR Am J Neuroradiol. 2008. PMID: 18339719 Free PMC article. Review.
Cited by
-
White matter microstructural characteristics in newly diagnosed Parkinson's disease: An unbiased whole-brain study.Sci Rep. 2016 Oct 20;6:35601. doi: 10.1038/srep35601. Sci Rep. 2016. PMID: 27762307 Free PMC article.
-
Tensor-valued diffusion MRI detects brain microstructure changes in HIV infected individuals with cognitive impairment.Res Sq [Preprint]. 2024 Jun 13:rs.3.rs-4482269. doi: 10.21203/rs.3.rs-4482269/v1. Res Sq. 2024. Update in: Sci Rep. 2024 Nov 21;14(1):28839. doi: 10.1038/s41598-024-80372-8. PMID: 38946952 Free PMC article. Updated. Preprint.
-
White matter integrity, hippocampal volume, and cognitive performance of a world-famous nonagenarian track-and-field athlete.Neurocase. 2016;22(2):135-44. doi: 10.1080/13554794.2015.1074709. Epub 2015 Aug 3. Neurocase. 2016. PMID: 26237526 Free PMC article.
-
Directional and inter-acquisition variability in diffusion-weighted imaging and editing for restricted diffusion.Magn Reson Med. 2022 Nov;88(5):2298-2310. doi: 10.1002/mrm.29385. Epub 2022 Jul 21. Magn Reson Med. 2022. PMID: 35861268 Free PMC article.
-
Localized high-resolution DTI of the human midbrain using single-shot EPI, parallel imaging, and outer-volume suppression at 7T.Magn Reson Imaging. 2013 Jul;31(6):810-9. doi: 10.1016/j.mri.2013.01.013. Epub 2013 Mar 29. Magn Reson Imaging. 2013. PMID: 23541390 Free PMC article.
References
-
- Le Bihan D, Breton E, Lallemand D, et al. MR imaging of intravoxel incoherent motions: application to diffusion and perfusion in neurologic disorders. Radiology 1986;161:401–07 - PubMed
-
- Warach S, Gaa J, Siewert B, et al. Acute human stroke studied by whole brain echo planar diffusion-weighted magnetic resonance imaging. Ann Neurol 1995;37:231–41 - PubMed
-
- Sorensen AG, Buananno FS, Gonzalez RG, et al. Hyperacute stroke: evaluation with combined multisection diffusion-weighted and hemodynamically weighted echo-planar MR imaging. Radiology 1996;199:391–401 - PubMed
-
- Basser PJ, Mattiello J, Le Bihan D. Estimation of the effective self-diffusion tensor from the NMR spin echo. J Magn Reson B 1994;103:247–54 - PubMed
Publication types
MeSH terms
LinkOut - more resources
Full Text Sources