. 2007 Jun 29;129(7):1415-26.
doi: 10.1016/j.cell.2007.05.052. Epub 2007 Jun 14.

Systematic discovery of in vivo phosphorylation networks

Affiliations

Systematic discovery of in vivo phosphorylation networks

Rune Linding et al. Cell. .

Abstract

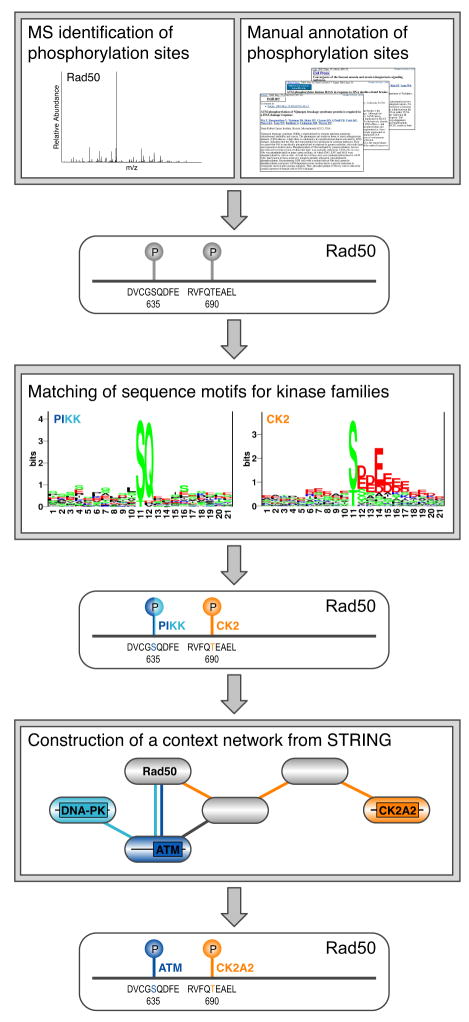
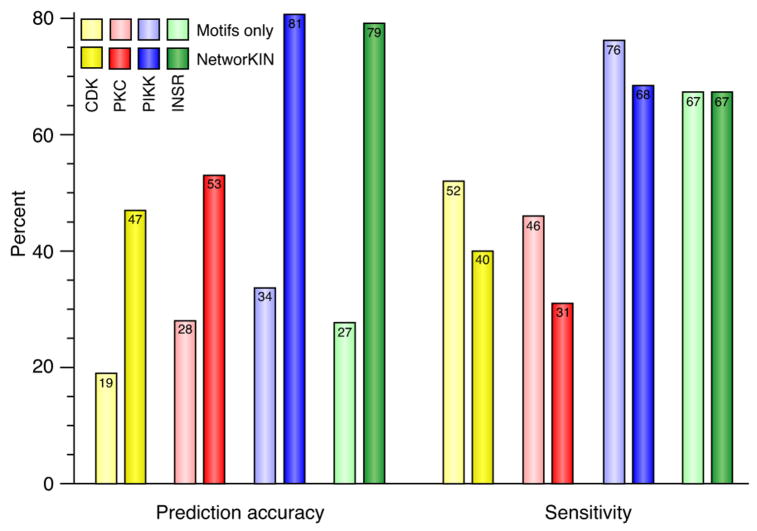
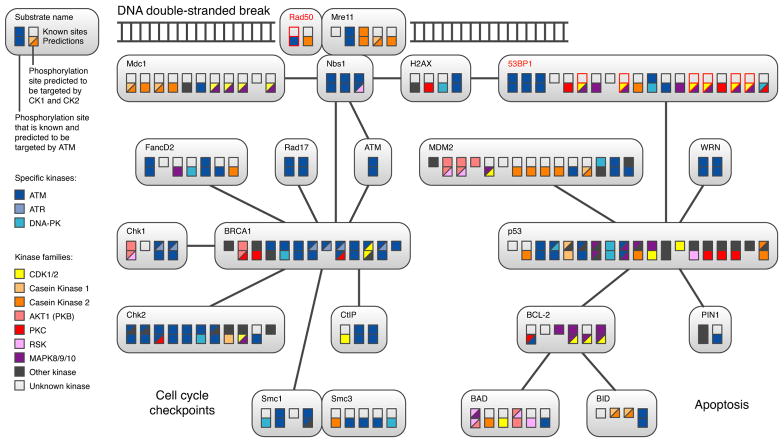
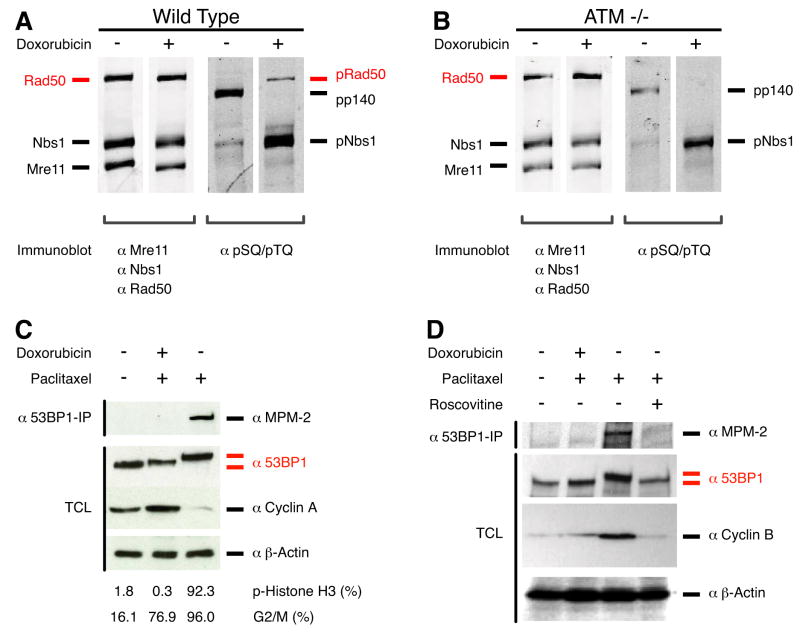
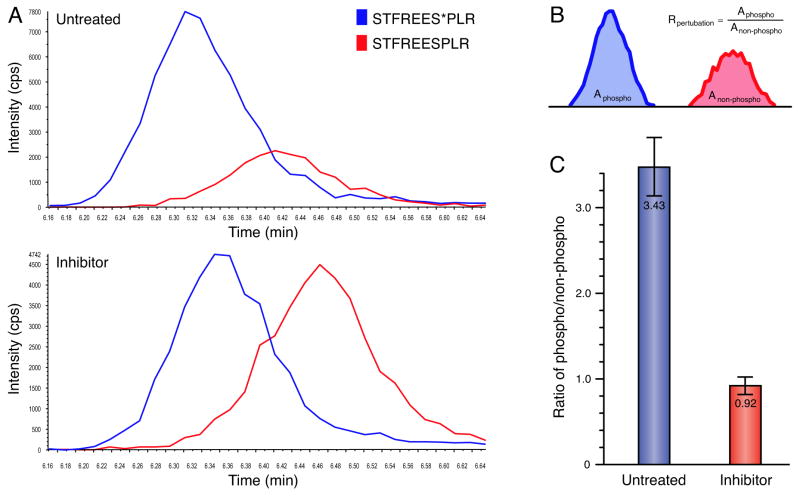
Protein kinases control cellular decision processes by phosphorylating specific substrates. Thousands of in vivo phosphorylation sites have been identified, mostly by proteome-wide mapping. However, systematically matching these sites to specific kinases is presently infeasible, due to limited specificity of consensus motifs, and the influence of contextual factors, such as protein scaffolds, localization, and expression, on cellular substrate specificity. We have developed an approach (NetworKIN) that augments motif-based predictions with the network context of kinases and phosphoproteins. The latter provides 60%-80% of the computational capability to assign in vivo substrate specificity. NetworKIN pinpoints kinases responsible for specific phosphorylations and yields a 2.5-fold improvement in the accuracy with which phosphorylation networks can be constructed. Applying this approach to DNA damage signaling, we show that 53BP1 and Rad50 are phosphorylated by CDK1 and ATM, respectively. We describe a scalable strategy to evaluate predictions, which suggests that BCLAF1 is a GSK-3 substrate.


Conflict of interest statement

The authors declare no competing financial interests.

Figures

Figure 1
Figure 1. Overview of the NetworKIN algorithm
Phosphorylation sites determined experimentally (for example, by mass spectrometry) are mapped to a protein sequence (in this case Rad50). The kinase family likely to be responsible for phosphorylation of a site is predicted by consensus motifs that model the known sequence preferences of kinase catalytic domains (Hjerrild et al., 2004; Obenauer et al., 2003). Secondly, STRING is used to construct a context network for each substrate based on interaction and pathway databases, literature mining, mRNA expression studies and genomic co-occurrence evidence (von Mering et al., 2005). Within this network the nearest member of the relevant kinase family is identified for each phosphorylation site; for example, between members of the PIKK kinase family predicted by motifs, ATM is chosen over DNA-PK, as its path to Rad50 is shorter (see Experimental Procedures). However, a direct interaction between a kinase and a substrate is not a requirement, as illustrated by CK2A2 (CK2α′).
Figure 2
Figure 2. Effects of including substrate context
Manually curated datasets of CDK, PKC, PIKK and INSR in vivo phosphorylation sites were used to assess the prediction accuracy (the fraction of predictions that are known to be correct) and sensitivity (the fraction of known sites that are correctly predicted) of NetworKIN and solely motif-based methods (NetPhosK and Scansite, (see Supplemental Experimental Procedures)). This shows that including the cellular context (in the form of a protein association network) leads to a significant improvement in accuracy. Notably, the accuracy of NetworKIN predictions is likely to be an underestimate since not all the kinases that target each phosphorylation site in the set of test proteins may currently be known from experiments.
Figure 3
Figure 3. Number of predictions in the human kinome
The human kinome consists of approximately 518 kinases (leafs) in a number of families (Manning et al., 2002). NetworKIN currently covers 20 of these families encompassing 112 individual kinases. Groups of kinases for which we do not have predictions are shown as collapsed branches (triangles). Using the complete Phospho.ELM database results in 7143 site-specific predicted kinase–substrate interactions (coloured bars indicate number of predicted phosphorylation sites) for 68 kinases. The figure was prepared with iTOL (Letunic and Bork, 2007)
Figure 4
Figure 4. Subcellular localisation of kinases and their substrates
A set of 960 cytoplasmic and 1327 nuclear phosphoproteins was extracted from the HPN based on subcellular localisation information from SwissProt. Among the predicted kinases we identified 17 kinases that showed a statistically significant preference for either cytoplasmic or nuclear substrates. These kinases were colour coded according to this preference and placed in the schematic figure according to their primary subcellular localisation; the kinases placed within the arrows are known to translocate to the nucleus upon activation or shuttle between the nucleus and the cytoplasm. Transmembrane and membrane-associated kinases are correctly predicted to selectively phosphorylate cytoplasmic substrates, whereas the kinases that are active only in the nucleus all show clear preference for nuclear substrates.
Figure 5
Figure 5. Phosphorylation in the DNA damage response
We modelled the primary DNA damage response and the apoptosis-related signalling by applying NetworKIN to in vivo phosphorylation sites (Diella et al., 2004). Only proteins that are known or predicted to be targeted by ATM are included. Boxes within each protein denote known phosphorylation sites, and are colour coded based on which kinases or kinase families are known (upper rows) or predicted (lower rows) to phosphorylate the site. In cases with multiple kinases predicted for a site, two kinases are shown as slashed boxes. A more comprehensive network (DDR+ subnetwork) containing additional proteins is included as an interaction map (Figure S6).
Figure 6
Figure 6. Phosphorylation of Rad50 and 53BP1
A, Rad50 was immunoprecipitated from EBV-transformed human ATMwt/wt or B, ATM−/− lymphoblasts. The immunoprecipates were separated by SDS-PAGE and immunoblotted for Rad50 and co-associating proteins, Mre11 and Nbs1. These same immunoprecipitates were also probed with a phospho-S/T-Q specific antibody that recognises ATM/ATR motifs (two right panels). Rad50 was phosphorylated in the wild-type cells but not in the ATM null cells in response to DNA damage as predicted. Nbs1 phosphorylation was reduced, but not eliminated, in the ATM null cells, suggesting that other PIKK kinases are also active in these lymphoblast cell lines, but that these are not responsible for Rad50 phosphorylation. When probing with the phospho-S/T-Q specific antibody, the Nbs1 band is stronger than the Rad50 band due to the presence of three ATM sites in Nbs1 but only a single site in Rad50. An unidentified protein, p140 was recognised by the phospho-S/T-Q antibody. C,D Human osteosarcoma U2OS cells were left untreated or treated with paclitaxel/doxorubicin (G2/M checkpoint arrest), paclitaxel (mitotic arrest), or paclitaxel with the CDK-inhibitor Roscovitine. Subsequently, cells were harvested and analysed in parallel by immunoblotting and FACS (C panel only for FACS). Percentages of mitotic cells (phospho-Histone H3 staining) and G2/M cells (propidium iodide) as determined by FACS analyses are shown below panel C. Immunoblotting of total cell lysates (TCL) or 53BP1 immunoprecipitations was performed with antibodies indicated to the right of the panels (see Supplemental Experimental Procedures). Only 53BP1 immunoprecipitated from mitotic cells was recognised by the phospho-specific antibody MPM-2, indicating that CDK1 is responsible for 53BP1 phosporylation in vivo.
Figure 7
Figure 7. Quantitative measurement of GSK3-dependent phosphorylation on BCLAF1
A, Multiple reaction monitoring of S531 on BCLAF1. Human embryonic kidney (HEK) 293 cells were left untreated (upper panel) or treated (lower panel) with the GSK3 inhibitor lithium. Each curve (extracted ion currents) represent a MRM elution profile corresponding to the phosphorylated (blue, STFREEsPLR) and non-phosphorylated (red, STFREESPLR) peptides (see Experimental Procedures). B, The calculation of phosphorylation levels is given by the ratio of the integrated ion-currents. C, Treatment with the GSK3 inhibitor lithium results in a 3.7 fold decrease of phosphorylation of BCLAF1 at S531. The error bars show standard deviations.

References

    1. Aebersold R, Mann M. Mass spectrometry-based proteomics. Nature. 2003;422:198–207. - PubMed
    1. Aloy P, Russell RB. The third dimension for protein interactions and complexes. Trends Biochem Sci. 2002;27:633–8. - PubMed
    1. Anderson L, Henderson C, Adachi Y. Phosphorylation and rapid relocalization of 53BP1 to nuclear foci upon DNA damage. Mol Cell Biol. 2001;21:1719–1729. - PMC - PubMed
    1. Anderson L, Hunter CL. Quantitative mass spectrometric multiple reaction monitoring assays for major plasma proteins. Mol Cell Proteomics. 2006;5:573–588. - PubMed
    1. Bain J, McLauchlan H, Elliott M, Cohen P. The specificities of protein kinase inhibitors: an update. Biochem J. 2003;371:199–204. - PMC - PubMed

Publication types

MeSH terms

Substances