

A global view of Staphylococcus aureus whole genome expression upon internalization in human epithelial cells
- PMID: 17570841
- PMCID: PMC1924023
- DOI: 10.1186/1471-2164-8-171
A global view of Staphylococcus aureus whole genome expression upon internalization in human epithelial cells
Abstract
Background: Staphylococcus aureus, a leading cause of chronic or acute infections, is traditionally considered an extracellular pathogen despite repeated reports of S. aureus internalization by a variety of non-myeloid cells in vitro. This property potentially contributes to bacterial persistence, protection from antibiotics and evasion of immune defenses. Mechanisms contributing to internalization have been partly elucidated, but bacterial processes triggered intracellularly are largely unknown.
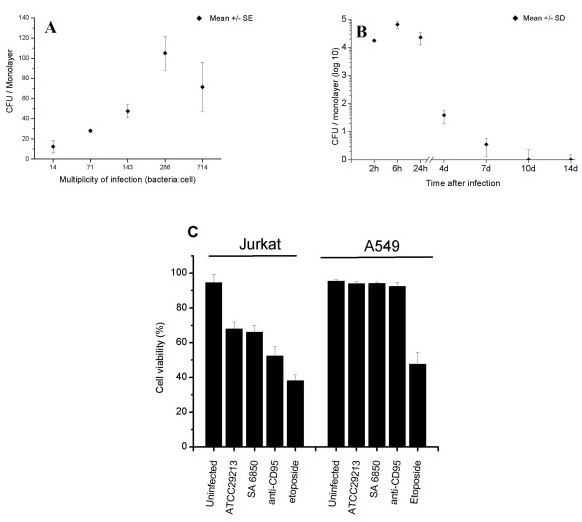
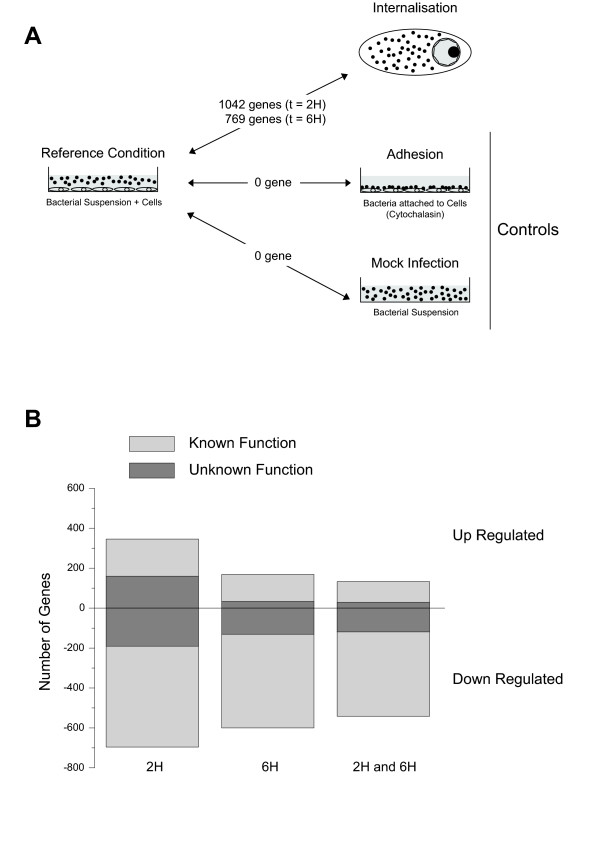
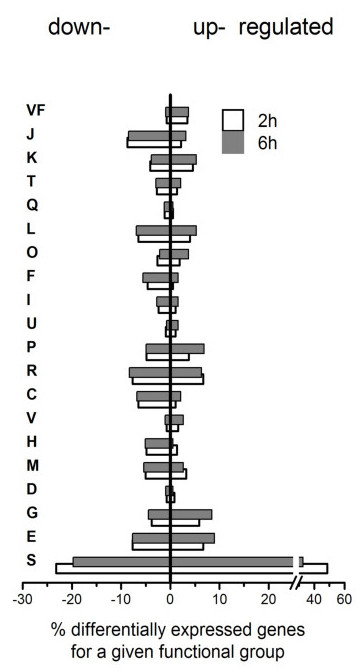
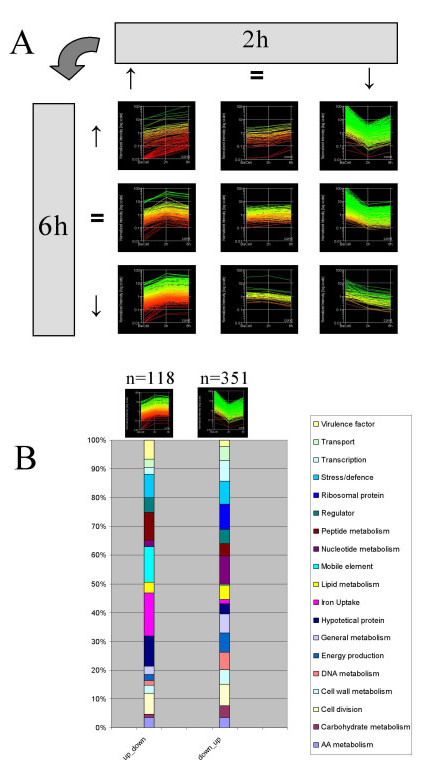
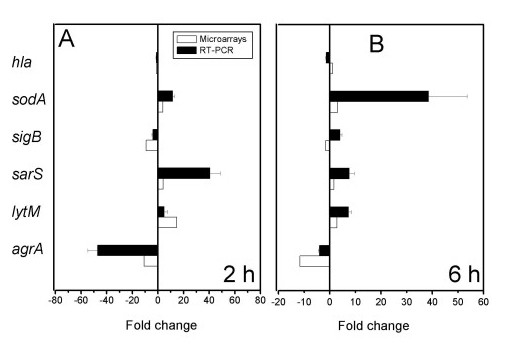
Results: We have developed an in vitro model using human lung epithelial cells that shows intracellular bacterial persistence for up to 2 weeks. Using an original approach we successfully collected and amplified low amounts of bacterial RNA recovered from infected eukaryotic cells. Transcriptomic analysis using an oligoarray covering the whole S. aureus genome was performed at two post-internalization times and compared to gene expression of non-internalized bacteria. No signs of cellular death were observed after prolonged internalization of Staphylococcus aureus 6850 in epithelial cells. Following internalization, extensive alterations of bacterial gene expression were observed. Whereas major metabolic pathways including cell division, nutrient transport and regulatory processes were drastically down-regulated, numerous genes involved in iron scavenging and virulence were up-regulated. This initial adaptation was followed by a transcriptional increase in several metabolic functions. However, expression of several toxin genes known to affect host cell integrity appeared strictly limited.
Conclusion: These molecular insights correlated with phenotypic observations and demonstrated that S. aureus modulates gene expression at early times post infection to promote survival. Staphylococcus aureus appears adapted to intracellular survival in non-phagocytic cells.
Figures
Similar articles
-
Transcriptional adaptations during long-term persistence of Staphylococcus aureus in the airways of a cystic fibrosis patient.Int J Med Microbiol. 2015 Jan;305(1):38-46. doi: 10.1016/j.ijmm.2014.10.005. Epub 2014 Oct 29. Int J Med Microbiol. 2015. PMID: 25439320
-
Global transcriptional profiles of Staphylococcus aureus treated with berberine chloride.FEMS Microbiol Lett. 2008 Feb;279(2):217-25. doi: 10.1111/j.1574-6968.2007.01031.x. Epub 2008 Jan 3. FEMS Microbiol Lett. 2008. PMID: 18179590
-
Genetic susceptibility to S. aureus mastitis in sheep: differential expression of mammary epithelial cells in response to live bacteria or supernatant.Physiol Genomics. 2012 Apr 2;44(7):403-16. doi: 10.1152/physiolgenomics.00155.2011. Epub 2012 Feb 14. Physiol Genomics. 2012. PMID: 22337903
-
Regulatory and genomic plasticity of Staphylococcus aureus during persistent colonization and infection.Int J Med Microbiol. 2004 Sep;294(2-3):195-202. doi: 10.1016/j.ijmm.2004.06.013. Int J Med Microbiol. 2004. PMID: 15493830 Review.
-
Staphylococcus aureus adaptation to the host and persistence: role of loss of capsular polysaccharide expression.Future Microbiol. 2010 Dec;5(12):1823-32. doi: 10.2217/fmb.10.147. Future Microbiol. 2010. PMID: 21155664 Review.
Cited by
-
Changes in the Staphylococcus aureus transcriptome during early adaptation to the lung.PLoS One. 2012;7(8):e41329. doi: 10.1371/journal.pone.0041329. Epub 2012 Aug 2. PLoS One. 2012. PMID: 22876285 Free PMC article.
-
Characterization of innate responses to influenza virus infection in a novel lung type I epithelial cell model.J Gen Virol. 2014 Feb;95(Pt 2):350-362. doi: 10.1099/vir.0.058438-0. Epub 2013 Nov 16. J Gen Virol. 2014. PMID: 24243730 Free PMC article.
-
Genome-wide analysis of ruminant Staphylococcus aureus reveals diversification of the core genome.J Bacteriol. 2008 Oct;190(19):6302-17. doi: 10.1128/JB.01984-07. Epub 2008 Jun 20. J Bacteriol. 2008. PMID: 18567666 Free PMC article.
-
Staphylococcus aureus phenotype switching: an effective bacterial strategy to escape host immune response and establish a chronic infection.EMBO Mol Med. 2011 Mar;3(3):129-41. doi: 10.1002/emmm.201000115. Epub 2011 Jan 26. EMBO Mol Med. 2011. PMID: 21268281 Free PMC article.
-
Metabolic footprint analysis uncovers strain specific overflow metabolism and D-isoleucine production of Staphylococcus aureus COL and HG001.PLoS One. 2013 Dec 3;8(12):e81500. doi: 10.1371/journal.pone.0081500. eCollection 2013. PLoS One. 2013. PMID: 24312553 Free PMC article.
References
-
- Fey PD, Said-Salim B, Rupp ME, Hinrichs SH, Boxrud DJ, Davis CC, Kreiswirth BN, Schlievert PM. Comparative molecular analysis of community- or hospital-acquired methicillin-resistant Staphylococcus aureus. Antimicrob Agents Chemother. 2003;47:196–203. doi: 10.1128/AAC.47.1.196-203.2003. - DOI - PMC - PubMed
-
- Archer GL. Staphylococcus aureus: a well-armed pathogen. Clin Infect Dis. 1998;26:1179–1181. - PubMed
Publication types
MeSH terms
LinkOut - more resources
Full Text Sources
Other Literature Sources
