. 2007 May 24;8 Suppl 5(Suppl 5):S5.
doi: 10.1186/1471-2105-8-S5-S5.

On consensus biomarker selection

Affiliations

On consensus biomarker selection

Janusz Dutkowski et al. BMC Bioinformatics. .

Abstract

Background: Recent development of mass spectrometry technology enabled the analysis of complex peptide mixtures. A lot of effort is currently devoted to the identification of biomarkers in human body fluids like serum or plasma, based on which new diagnostic tests for different diseases could be constructed. Various biomarker selection procedures have been exploited in recent studies. It has been noted that they often lead to different biomarker lists and as a consequence, the patient classification may also vary.

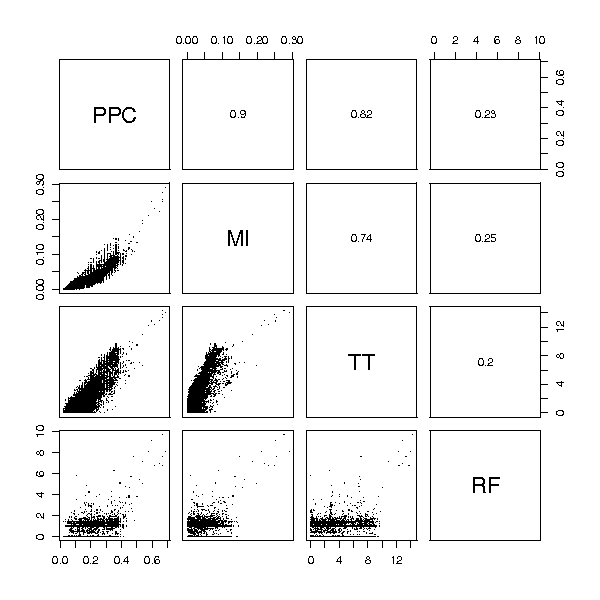
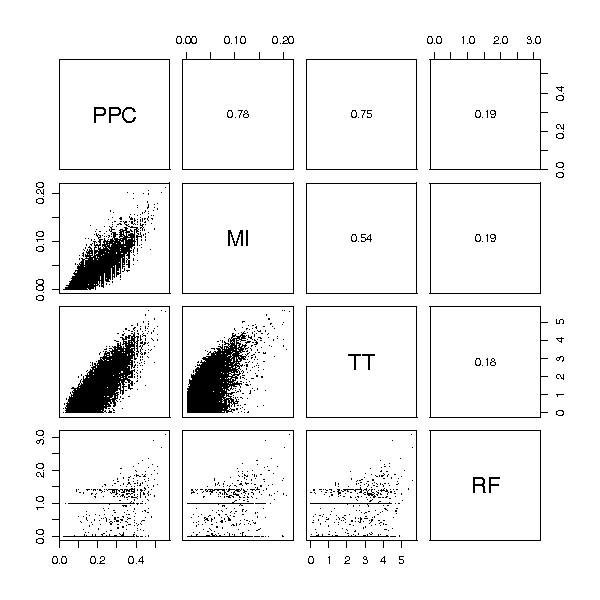
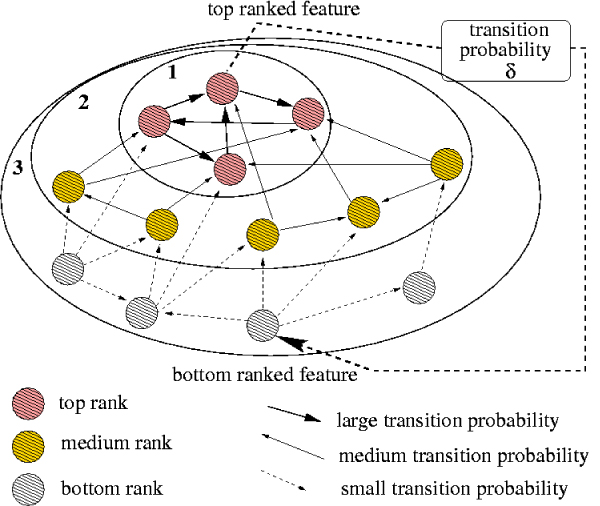
Results: Here we propose a new approach to the biomarker selection problem: to apply several competing feature ranking procedures and compute a consensus list of features based on their outcomes. We validate our methods on two proteomic datasets for the diagnosis of ovarian and prostate cancer.

Conclusion: The proposed methodology can improve the classification results and at the same time provide a unified biomarker list for further biological examinations and interpretation.


Figures

Figure 1
Figure 1
Biomarker comparison. Best 10 peaks (i.e. peptide signals) from the Ovarian cancer dataset selected using PPC (left) and t-statistics (right). Each small panel shows a histogram of peak heights in the training set at one m/z value for healthy patients (top) and cancer patients (bottom). Vertical line corresponds to the estimated optimal height split point (see [7] for details). The proportions of samples in each class having peaks higher than the split point are indicated (e.g. for top left corner panel these proportions are respectively 0.13 and 0.68). Notice that the two selected sets have only 3 peaks in common.
Figure 2
Figure 2
Prostate cancer classification results. Classification results for four classifiers (random forest (RF), SVM, decision trees (DT) and LDA) on the SELDI-TOF prostate cancer dataset are shown separately in the four panels. Classifier performance using a specified number of best features from individual scoring functions (peak probability contrast (PPC), mutual information (MI), t-statistic (TT) and random forest feature ranking (RF)) are plotted in black. Performance with features selected by MC4 rank aggregation of the four functions is shown in blue. Results for regular PCA and our modified "Consensus" version using only the best features from the four scoring functions are plotted in green and red respectively. For all methods the average accuracy (fraction of samples correctly classified) over 20 cross-validation runs is shown. See Section Results for discussion.
Figure 3
Figure 3
Ovarian cancer classification results. Classification results for four classifiers (random forest (RF), SVM, decision trees (DT) and LDA) on the MALDI-TOF ovarian cancer dataset are shown separately in the four panels. Classifier performance using a specified number of best features from individual scoring functions (peak probability contrast (PPC), mutual information (MI), t-statistic (TT) and random forest feature ranking (RF)) are plotted in black. Performance with features selected by MC1 rank aggregation of the four functions is shown in blue. Results for regular PCA and our modified "Consensus" version using only the best features from the four scoring functions are plotted in green and red respectively. For all methods the average accuracy (fraction of samples correctly classified) over 20 cross-validation runs is shown. See Section Results for discussion.
Figure 4
Figure 4
Method overview. The control flow through different phases of the proposed method: we start with a preprocessed MS dataset; apply several competing biomarker selection procedures (t-statistic, peak probability contrasts (PPC), mutual information and random forest feature ranking); achieve their consensus by the Markov chain rank aggregation method or PCA and train the classifiers (LDA, random forest, SVM, decision trees) on consensus features. For performance assessment the steps are repeated for each fold of the ten-fold cross-validation scheme.
Figure 5
Figure 5
Prostate cancer data ranking comparison. Rankings obtained from several feature selection methods for the Prostate cancer dataset. Each small panel shows the comparison of two rankings. A point with coordinates (i, j) corresponds to the feature with score i in one method and score j in the other (for all methods the most important features receive the highest scores). Values of the Spearman correlation coefficient for each pair of scoring functions are given in the panels above the diagonal. The random forest feature ranking (RF) is considerably different than the rest. Peak probability contrast method (PPC), mutual information (MI) and t-statistic (TT) share a common group of the highest scored features, but significant differences can be observed in ranks of less important features, which also provide valuable information for classification.
Figure 6
Figure 6
Ovarian cancer data ranking comparison. Comparison of rankings obtained from several feature selection methods for the Ovarian cancer dataset. Each small panel shows the comparison of two rankings. A point with coordinates (i, j) corresponds to the feature with score i in one method and score j in the other (for each method the most important features receive the highest scores). Values of the Spearman correlation coefficient for each pair of scoring functions are given in the panels above the diagonal. Notice significant differences between various rankings even within the group of the highest scored features. RF ranking stands out the most as in the case of prostate cancer data.
Figure 7
Figure 7
Markov chain hierarchical structure. The structure of the state space graph for rank aggregation Markov chain MC1. The type of edge corresponds to the transition probability. Ellipses surround the top ranked features appearing in each phase (from 1 up to 3 in this example). States joined at an earlier stage have higher stationary probability, and therefore rank higher in the aggregated ranking.

References

    1. Adam BL, Qu Y, Davis JW, Ward MD, Clements MA, Cazares LH, Semmes OJ, Schellhammer PF, Yasui Y, Feng Z, Wright GLJ. Serum protein fingerprinting coupled with a pattern-matching algorithm distinguishes prostate cancer from benign prostate hyperplasia and healthy men. Cancer Research. 2002;62:3609–3614. - PubMed
    1. Geurts P, Fillet M, de Seny D, Meuwis MA, Malaise M, Merville MP, Wehenkel L. Proteomic mass spectra classification using decision tree based ensemble methods. Bioinformatics. 2005;21:3138–3145. doi: 10.1093/bioinformatics/bti494. - DOI - PubMed
    1. Jacobs IJ, Menon U. Progress and challenges in screening for early detection of ovarian cancer. Mol Cell Proteomics. 2004;3:355–366. doi: 10.1074/mcp.R400006-MCP200. - DOI - PubMed
    1. Lilien RH, Farid H, Donald BR. Probabilistic disease classification of expression-dependent proteomic data from mass spectrometry of human serum. Journal of Computational Biology. 2003;10:925–946. doi: 10.1089/106652703322756159. - DOI - PubMed
    1. Li J, Zhang Z, Rosenzweig J, Wang YY, Chan DW. Proteomics and bioinformatics approaches for identification of serum biomarkers to detect breast cancer. Clinical Chemistry. 2002;48:1296–1304. - PubMed

Publication types