. 2007 Jun 14;447(7146):799-816.
doi: 10.1038/nature05874.

Identification and analysis of functional elements in 1% of the human genome by the ENCODE pilot project

ENCODE Project ConsortiumEwan BirneyJohn A StamatoyannopoulosAnindya DuttaRoderic GuigóThomas R GingerasElliott H MarguliesZhiping WengMichael SnyderEmmanouil T DermitzakisRobert E ThurmanMichael S KuehnChristopher M TaylorShane NephChristoph M KochSaurabh AsthanaAnkit MalhotraIvan AdzhubeiJason A GreenbaumRobert M AndrewsPaul FlicekPatrick J BoyleHua CaoNigel P CarterGayle K ClellandSean DavisNathan DayPawandeep DhamiShane C DillonMichael O DorschnerHeike FieglerPaul G GiresiJeff GoldyMichael HawrylyczAndrew HaydockRichard HumbertKeith D JamesBrett E JohnsonEricka M JohnsonTristan T FrumElizabeth R RosenzweigNeerja KarnaniKirsten LeeGregory C LefebvrePatrick A NavasFidencio NeriStephen C J ParkerPeter J SaboRichard SandstromAnthony ShaferDavid VetrieMolly WeaverSarah WilcoxMan YuFrancis S CollinsJob DekkerJason D LiebThomas D TulliusGregory E CrawfordShamil SunyaevWilliam S NobleIan DunhamFrance DenoeudAlexandre ReymondPhilipp KapranovJoel RozowskyDeyou ZhengRobert CasteloAdam FrankishJennifer HarrowSrinka GhoshAlbin SandelinIvo L HofackerRobert BaertschDamian KeefeSujit DikeJill ChengHeather A HirschEdward A SekingerJulien LagardeJosep F AbrilAtif ShahabChristoph FlammClaudia FriedJörg HackermüllerJana HertelManja LindemeyerKristin MissalAndrea TanzerStefan WashietlJan KorbelOlof EmanuelssonJakob S PedersenNancy HolroydRuth TaylorDavid SwarbreckNicholas MatthewsMark C DicksonDaryl J ThomasMatthew T WeirauchJames GilbertJorg DrenkowIan BellXiaoDong ZhaoK G SrinivasanWing-Kin SungHong Sain OoiKuo Ping ChiuSylvain FoissacTyler AliotoMichael BrentLior PachterMichael L TressAlfonso ValenciaSiew Woh ChooChiou Yu ChooCatherine UclaCaroline ManzanoCarine WyssEvelyn CheungTaane G ClarkJames B BrownMadhavan GaneshSandeep PatelHari TammanaJacqueline ChrastCharlotte N HenrichsenChikatoshi KaiJun KawaiUgrappa NagalakshmiJiaqian WuZheng LianJin LianPeter NewburgerXueqing ZhangPeter BickelJohn S MattickPiero CarninciYoshihide HayashizakiSherman WeissmanTim HubbardRichard M MyersJane RogersPeter F StadlerTodd M LoweChia-Lin WeiYijun RuanKevin StruhlMark GersteinStylianos E AntonarakisYutao FuEric D GreenUlaş KaraözAdam SiepelJames TaylorLaura A LieferKris A WetterstrandPeter J GoodElise A FeingoldMark S GuyerGregory M CooperGeorge AsimenosColin N DeweyMinmei HouSergey NikolaevJuan I Montoya-BurgosAri LöytynojaSimon WhelanFabio PardiTim MassinghamHaiyan HuangNancy R ZhangIan HolmesJames C MullikinAbel Ureta-VidalBenedict PatenMichael SeringhausDeanna ChurchKate RosenbloomW James KentEric A StoneNISC Comparative Sequencing ProgramBaylor College of Medicine Human Genome Sequencing CenterWashington University Genome Sequencing CenterBroad InstituteChildren's Hospital Oakland Research InstituteSerafim BatzoglouNick GoldmanRoss C HardisonDavid HausslerWebb MillerArend SidowNathan D TrinkleinZhengdong D ZhangLeah BarreraRhona StuartDavid C KingAdam AmeurStefan EnrothMark C BiedaJonghwan KimAkshay A BhingeNan JiangJun LiuFei YaoVinsensius B VegaCharlie W H LeePatrick NgAtif ShahabAnnie YangZarmik MoqtaderiZhou ZhuXiaoqin XuSharon SquazzoMatthew J OberleyDavid InmanMichael A SingerTodd A RichmondKyle J MunnAlvaro Rada-IglesiasOla WallermanJan KomorowskiJoanna C FowlerPhillippe CouttetAlexander W BruceOliver M DoveyPeter D EllisCordelia F LangfordDavid A NixGhia EuskirchenStephen HartmanAlexander E UrbanPeter KrausSara Van CalcarNate HeintzmanTae Hoon KimKun WangChunxu QuGary HonRosa LunaChristopher K GlassM Geoff RosenfeldShelley Force AldredSara J CooperAnason HaleesJane M LinHennady P ShulhaXiaoling ZhangMousheng XuJaafar N S HaidarYong YuYijun RuanVishwanath R IyerRoland D GreenClaes WadeliusPeggy J FarnhamBing RenRachel A HarteAngie S HinrichsHeather TrumbowerHiram ClawsonJennifer Hillman-JacksonAnn S ZweigKayla SmithArchana ThakkapallayilGalt BarberRobert M KuhnDonna KarolchikLluis ArmengolChristine P BirdPaul I W de BakkerAndrew D KernNuria Lopez-BigasJoel D MartinBarbara E StrangerAbigail WoodroffeEugene DavydovAntigone DimasEduardo EyrasIngileif B HallgrímsdóttirJulian HuppertMichael C ZodyGonçalo R AbecasisXavier EstivillGerard G BouffardXiaobin GuanNancy F HansenJacquelyn R IdolValerie V B MaduroBaishali MaskeriJennifer C McDowellMorgan ParkPamela J ThomasAlice C YoungRobert W BlakesleyDonna M MuznyErica SodergrenDavid A WheelerKim C WorleyHuaiyang JiangGeorge M WeinstockRichard A GibbsTina GravesRobert FultonElaine R MardisRichard K WilsonMichele ClampJames CuffSante GnerreDavid B JaffeJean L ChangKerstin Lindblad-TohEric S LanderMaxim KoriabineMikhail NefedovKazutoyo OsoegawaYuko YoshinagaBaoli ZhuPieter J de Jong

Identification and analysis of functional elements in 1% of the human genome by the ENCODE pilot project

ENCODE Project Consortium et al. Nature. .

Abstract

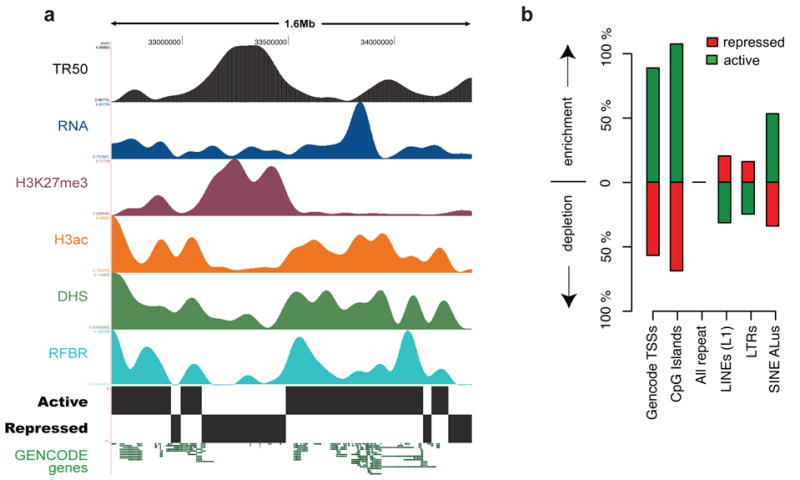
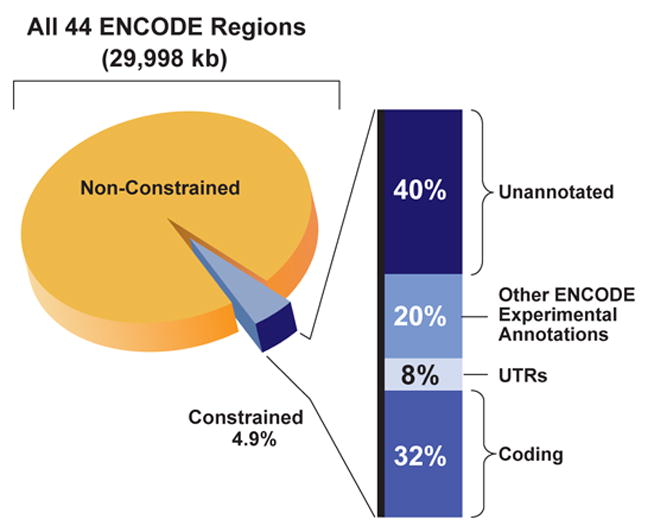
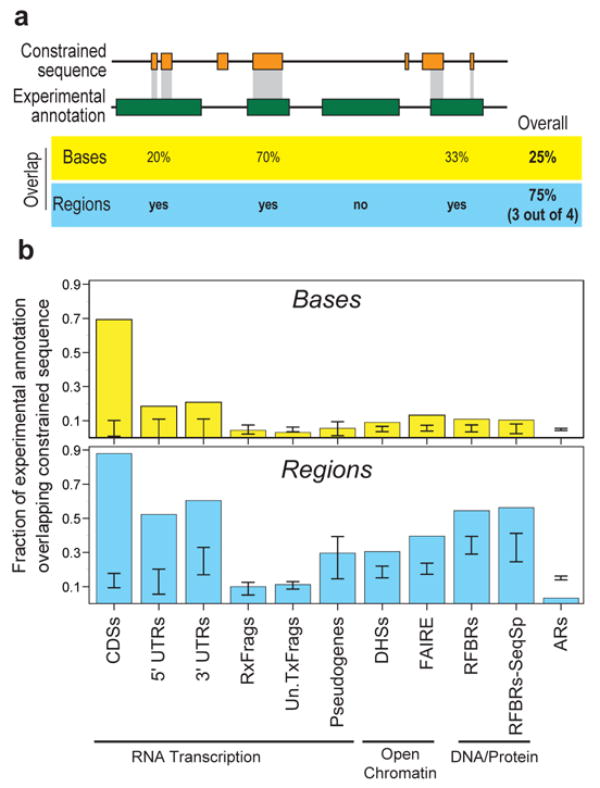
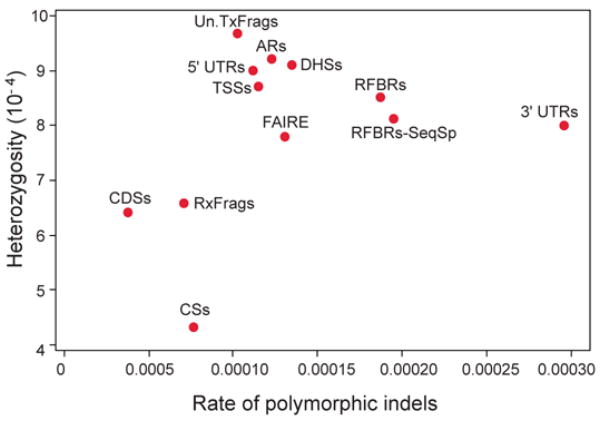
We report the generation and analysis of functional data from multiple, diverse experiments performed on a targeted 1% of the human genome as part of the pilot phase of the ENCODE Project. These data have been further integrated and augmented by a number of evolutionary and computational analyses. Together, our results advance the collective knowledge about human genome function in several major areas. First, our studies provide convincing evidence that the genome is pervasively transcribed, such that the majority of its bases can be found in primary transcripts, including non-protein-coding transcripts, and those that extensively overlap one another. Second, systematic examination of transcriptional regulation has yielded new understanding about transcription start sites, including their relationship to specific regulatory sequences and features of chromatin accessibility and histone modification. Third, a more sophisticated view of chromatin structure has emerged, including its inter-relationship with DNA replication and transcriptional regulation. Finally, integration of these new sources of information, in particular with respect to mammalian evolution based on inter- and intra-species sequence comparisons, has yielded new mechanistic and evolutionary insights concerning the functional landscape of the human genome. Together, these studies are defining a path for pursuit of a more comprehensive characterization of human genome function.


Figures

Figure 1
Figure 1
Annotated and unannotated TxFrags detected in different cell lines. The proportion of different types of transcripts detected in the indicated number of cell lines (from 1/11 at the far left to 11/11 at the far right) is shown. The data for annotated and unannotated TxFrags are indicated separately, and also split into different categories based on GENCODE classification: Exonic, Intergenic (Proximal being within 5 kb of a gene and Distal being otherwise), Intronic (Proximal being within 5 kb of an intron and Distal being otherwise), and matching other ESTs not used in the GENCODE annotation (principally because they were unspliced). The y-axis indicates the percent of tiling array nucleotides present in that class for that number of tissues.
Figure 2
Figure 2
Length of genomic extensions to GENCODE-annotated genes based on RACE experiments followed by array hybridisations (RxFrags). The indicated bars reflect the frequency of extension lengths among different length classes. The solid line shows the cumulative frequency of extensions of that length or greater. Most of the extensions are greater than 50 kb from the annotated gene (see text for details).
Figure 3
Figure 3
Overview of RACE experiments showing a gene fusion. Transcripts emanating from the region between the DONSON and ATP50 genes. A 330-kb interval of human chromosome 21 (within ENm005) is shown, which contains four annotated genes: DONSON, CRYZL1, ITSN1, and ATP50. The 5′ RACE products generated from small intestine RNA and detected by tiling-array analyses (RxFrags) are shown along the top. Along the bottom is shown the placement of a cloned and sequenced RT-PCR product that has two exons from the DONSON gene followed by three exons from the ATP50 gene; these sequences are separated by a 300-kb intron in the genome. A PET tag shows the termini of a transcript consistent with this RT-PCR product.
Figure 4
Figure 4
Coverage of primary transcripts across ENCODE regions. Three different technologies [integrated annotation from GENCODE, RACE-array experiments (RxFrags), and PET tags] were used to assess the presence of a nucleotide in a primary transcript. Use of these technologies provided the opportunity to have multiple observations of each finding. The proportion of genomic bases detected in the ENCODE regions associated with each of the following scenarios is depicted: detected by all three technologies, by two of the three technologies, by one technology but with multiple observations, and by one technology with only one observation. Also indicated are genomic bases without any detectable coverage of primary transcripts.
Figure 5
Figure 5
Aggregate signals of tiling-array experiments from either ChIP-chip or chromatin structure assays, represented for different classes of TSS and DHS. For each plot, the signal was first normalised with a mean of 0 and standard deviation of 1, and then the normalised scores were summed at each position for that class of TSS or DHS and smoothed using a kernel density method (see Supplementary Information section S3.6). For each class of sites there are two adjacent plots. The left hand plot depicts the data for general factors: FAIRE and DNaseI sensitivity as assays of chromatin accessibility and H3K4me1, H3K4me2, H3K4me3, H3ac, and H4ac histone modifications (as indicated); the right hand plot shows the data for additional factors, namely cMyc, E2F1, E2F4, CTCF, BAF155, and PolII. The columns provide data for the different classes of TSS class or DHS (unsmoothed data and statistical analysis shown in Supplementary Information section S3.6).
Figure 6
Figure 6
Distribution of RFBRs relative to GENCODE TSSs. Different RFBRs from Sequence Specific factors (Red) or general factors (Blue) are plotted showing their relative distribution near TSSs. The x-axis indicates the proportion of TSSs close (within 2.5KB) to the specified factor. The y-axis indicates the proportion of RFBRs close to TSSs. The size of the circle provides an indication of the number of RFBRs for each factor. A handful of representative factors are labelled.
Figure 7
Figure 7
Correlation between replication timing and histone modifications. (a) Comparison of two histone modifications (H3K4me2 and H3K27me3), plotted as enrichment ratio from the Chip-chip experiments and the time for 50% of the DNA to replicate (TR50), indicated for ENCODE region ENm006. The colours on the curves reflect the correlation strength in a sliding 250 kb window. (b) Differing levels of histone modification for different TR50 partitions. The amounts of enrichment or depletion of different histone modifications in various cell lines are depicted (indicated along the bottom as ‘Histone mark.Cell line’; GM= GM06990). Asterisks indicate enrichments/depletions that are not significant based on multiple tests. Each set has four partitions based on replication timing: Early, Mid, Late, and PanS.
Figure 8
Figure 8
Wavelet correlations of histone marks and DNaseI sensitivity. As an example, correlations between DNaseI sensitivity and H3K4me2 (both in the GM06990 cell line) over a 1.1-Mb region on chromosome 7 (ENCODE region ENm013) are shown. (a) The relationship between histone modification H3K4me2 (upper plot) and DNaseI sensitivity (lower plot) is shown for ENCODE region ENm013. The curves are coloured with the strength of the local correlation at the 4-kb scale (top dashed line in panel b). (b) The same data as in a are represented as a wavelet correlation. The y-axis shows the differing scales decomposed by the wavelet analysis from large to small scale (in kb); the colour at each point in the heatmap represents the level of correlation at the given scale, measured in a 20-kb window centered at the given position. (c) Distribution of correlation values at the 16-kb scale between the indicated histone marks and. The x-axis shows different correlation values. The Y-axis is the density of these correlation values across ENCODE; all modifications show a peak at a positive-correlation value.
Figure 9
Figure 9
Higher-order functional domains in the genome. The general concordance of multiple data types is illustrated for an illustrative ENCODE region (ENm005). (a) Domains were determined by simultaneous HMM segmentation of replication time (TR50; black), bulk RNA transcription (blue), H3K27me3 (purple), H3ac (orange), DHS density (green), and RFBR density (light blue) measured continuously across the 1.6-Mb ENm005. All data were generated using HeLa cells. The histone, RNA, DHS, and RFBR signals are wavelet-smoothed to an approximately 60 kb scale (see Supplementary Information section S4.7). The HMM segmentation is shown as the blocks labeled “active” and “repressed” and the structure of GENCODE genes (not used in the training) is shown at the end. (b) Enrichment or depletion of annotated sequence features (GENCODE TSSs, CpG islands, different types of repetitive elements, and non-exonic CSs) in active versus repressed domains. Note the marked enrichment of TSSs, CpG islands, and Alus in active domains, and the enrichment of LINE and LTRs in repressed domains.
Figure 10
Figure 10
Relative proportion of different annotations among constrained sequences. The 4.9% of bases in the ENCODE regions identified as constrained is subdivided into the portions that reflect known coding regions, UTRs, other experimentally-annotated regions, and unannotated sequence.
Figure 11
Figure 11
Overlap of constrained sequences and various experimental annotations. (a) A schematic depiction shows the different tests used for assessing overlap between experimental annotations and constrained sequences, both for individual bases and for entire regions. (b) Observed fraction of overlap, depicted separately for bases and regions. The results are shown for selected experimental annotations. The internal bars indicate 95% confidence intervals of randomised placement of experimental elements using the GSC methodology to account for heterogeneity in the datasets. When the bar overlaps the observed value one cannot reject the hypothesis that these overlaps are consistent with random placements.
Figure 12
Figure 12
Relationship between heterozygosity and polymorphic indel rate for a variety of experimental annotations.. 3′UTRs are an expected outlier for the indel measures due to the presence of low-complexity sequence (leading to a higher indel rate).
Figure 13
Figure 13
CNV enrichment. The relative enrichment of different experimental annotations in ENCODE regions associated with CNVs. CS_non-CDS are constrained sequences outside of coding regions. A value of 1 or less indicates no enrichment, and values greater than 1 show enrichment. Starred columns are cases that are significant based on this enrichment being found in less than 5% of randomisations which matched each element class for length and density of features.

Comment in

References

    1. International Human Genome Sequencing Consortium. Initial sequencing and analysis of the human genome. Nature. 2001;409:860–921. - PubMed
    1. Venter JC, et al. The sequence of the human genome. Science. 2001;291:1304–51. - PubMed
    1. International Human Genome Sequencing Consortium. Finishing the euchromatic sequence of the human genome. Nature. 2004;431:931–45. - PubMed
    1. International Mouse Genome Sequencing Consortium. Initial sequencing and comparative analysis of the mouse genome. Nature. 2002;420:520–62. - PubMed
    1. Rat Genome Sequencing Project Consortium. Genome sequence of the Brown Norway rat yields insights into mammalian evolution. Nature. 2004;428:493–521. - PubMed

Publication types

MeSH terms