. 2007 Jul;9(7):832-7.
doi: 10.1038/ncb1609. Epub 2007 Jun 17.

Tension applied through the Dam1 complex promotes microtubule elongation providing a direct mechanism for length control in mitosis

Affiliations

Tension applied through the Dam1 complex promotes microtubule elongation providing a direct mechanism for length control in mitosis

Andrew D Franck et al. Nat Cell Biol. 2007 Jul.

Abstract

In dividing cells, kinetochores couple chromosomes to the tips of growing and shortening microtubule fibres and tension at the kinetochore-microtubule interface promotes fibre elongation. Tension-dependent microtubule fibre elongation is thought to be essential for coordinating chromosome alignment and separation, but the mechanism underlying this effect is unknown. Using optical tweezers, we applied tension to a model of the kinetochore-microtubule interface composed of the yeast Dam1 complex bound to individual dynamic microtubule tips. Higher tension decreased the likelihood that growing tips would begin to shorten, slowed shortening, and increased the likelihood that shortening tips would resume growth. These effects are similar to the effects of tension on kinetochore-attached microtubule fibres in many cell types, suggesting that we have reconstituted a direct mechanism for microtubule-length control in mitosis.


Figures
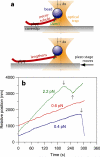
Figure 1
Figure 1
Recording microtubule dynamics with tension applied by an optical trapping-based force clamp. (a) Schematic showing experimental geometry and force clamp operation. A polystyrene bead (blue) is held by an optical trap (orange). Dam1 complex (green) on the bead surface mediates attachment to the tip of a dynamic microtubule (red). A portion of the microtubule (dark red) is anchored to the coverslip. As the microtubule grows and shortens, the coverslip is moved via computer to keep a fixed separation (Δx) between the bead and trap, thereby maintaining a constant level of tension. (b) Three (of N = 298) representative records showing position against time for tip-attached beads under tension. Increasing position represents bead movement away from the anchored portion of the filament during microtubule growth. Decreasing position represents movement toward the anchored seed during filament shortening. Arrows mark catastrophe and rescue events. More example records are shown in Fig. 2.
Figure 2
Figure 2
Additional records showing microtubule dynamics with applied tension. (a) Three records showing growth, catastrophe (arrows), and shortening at the indicated levels of tension. (b) Two records showing growth, catastrophe (downward arrows), shortening, and rescue (upward arrows).
Figure 3
Figure 3
Tension slows shortening, inhibits catastrophe, and promotes rescue. (a, b) Distributions of growth and shortening speeds at two levels of tension. Growth speed distributions at 2.0 pN (a, red histogram) and 0.5 pN (a, blue histogram) are similar in shape. The distribution of shortening speeds, however, is shifted toward lower values at 2.0 pN (b, red histogram) as compared to 0.5 pN (b, blue histogram). (c, d) Mean growth (c) and shortening speeds (d) plotted against tensile force. Uncertainties in speed and force represent s.e.m. and s.d., respectively. (e, f) Catastrophe (e) and rescue (f) rates plotted against tensile force. Uncertainties in transition rates represent counting errors. (g) Distributions of tensile force for the dataset. (h) Rates of bead detachment from shortening and growing tips, estimated by counting the number of detachment events and dividing by the total observation time in each phase. Uncertainties in detachment rate represent counting errors.
Figure 4
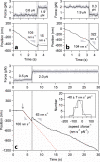
Figure 4
Changing the level of tension during movement immediately alters shortening speed. (ac) Three (of N = 27) representative records showing tensile force (upper plots) and bead position (lower plots) against time during disassembly-driven movement. In these force-switch experiments, the instrument was programmed to automatically change the level of tension after a pre-specified amount of movement occurred. Dashed vertical lines denote intervals (∼0.2 s duration) when the force was changing. Shortening speeds before and after the change in force are indicated (gray triangles). In c, the arrow marks a catastrophe and the dashed red line shows a least-squares fit to the portion of the trace preceding the change in force. The inset shows the distribution of sensitivities, Δspeed Δforce−1, computed from each record by dividing the change in speed by the change in force.

References

    1. Inoue S, Salmon ED. Force generation by microtubule assembly/disassembly in mitosis and related movements. Mol Biol Cell. 1995;6:1619–40. - PMC - PubMed
    1. Koshland DE, Mitchison TJ, Kirschner MW. Polewards chromosome movement driven by microtubule depolymerization in vitro. Nature. 1988;331:499–504. - PubMed
    1. Nicklas RB. The forces that move chromosomes in mitosis. Annu Rev Biophys Biophys Chem. 1988;17:431–49. - PubMed
    1. Skibbens RV, Salmon ED. Micromanipulation of chromosomes in mitotic vertebrate tissue cells: tension controls the state of kinetochore movement. Exp Cell Res. 1997;235:314–24. - PubMed
    1. Khodjakov A, Rieder CL. Kinetochores moving away from their associated pole do not exert a significant pushing force on the chromosome. J Cell Biol. 1996;135:315–27. - PMC - PubMed

Publication types

MeSH terms

Substances