. 2007 Jun 17:7:31.
doi: 10.1186/1471-2229-7-31.

Restricted cell elongation in Arabidopsis hypocotyls is associated with a reduced average pectin esterification level

Affiliations

Restricted cell elongation in Arabidopsis hypocotyls is associated with a reduced average pectin esterification level

Paul Derbyshire et al. BMC Plant Biol. .

Abstract

Background: Cell elongation is mainly limited by the extensibility of the cell wall. Dicotyledonous primary (growing) cell walls contain cellulose, xyloglucan, pectin and proteins, but little is known about how each polymer class contributes to the cell wall mechanical properties that control extensibility.

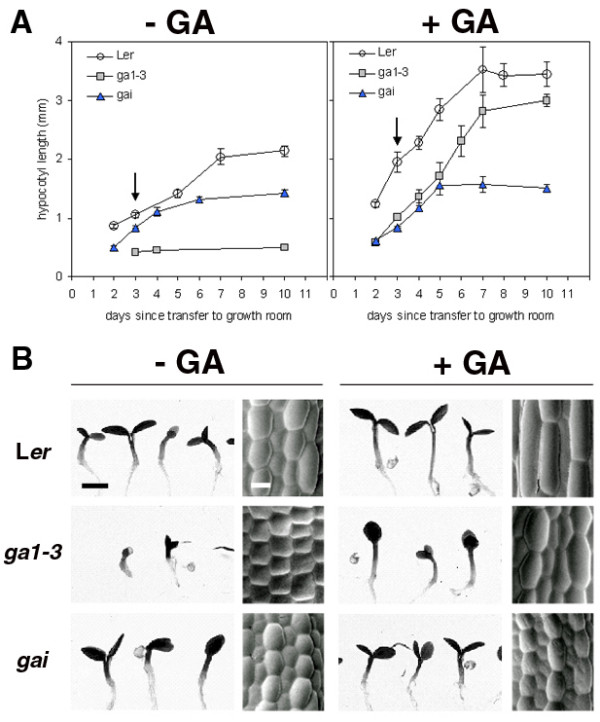
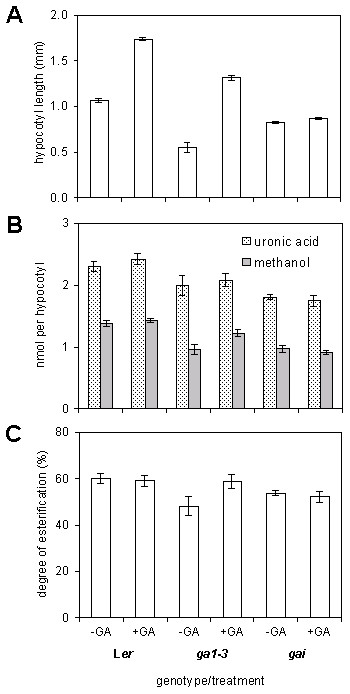
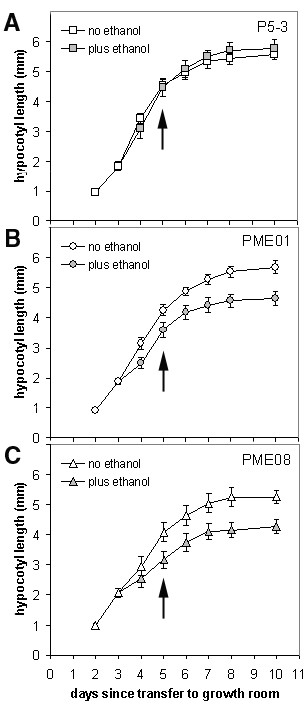
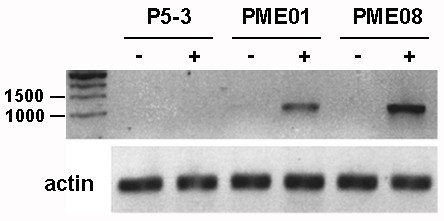
Results: We present evidence that the degree of pectin methyl-esterification (DE%) limits cell growth, and that a minimum level of about 60% DE is required for normal cell elongation in Arabidopsis hypocotyls. When the average DE% falls below this level, as in two gibberellic acid (GA) mutants ga1-3 and gai, and plants expressing pectin methyl-esterase (PME1) from Aspergillus aculeatus, then hypocotyl elongation is reduced.

Conclusion: Low average levels of pectin DE% are associated with reduced cell elongation, implicating PMEs, the enzymes that regulate DE%, in the cell elongation process and in responses to GA. At high average DE% other components of the cell wall limit GA-induced growth.


Figures

Figure 1
Figure 1
Growth kinetics and hypocotyl cell elongation in WT (Ler), ga1-3, and gai seedlings grown with and without exogenous gibberellic acid (GA). (A) Seedlings were grown in continuous light for 10 d with plates in a horizontal position and hypocotyl growth measured over this period. Measurements are an average taken from 5 to 15 seedlings ± SE for each time point. Arrows indicate time (3 d) at which hypocotyls were at approximately 50% of their final length. (B) Light micrographs showing phenotypes of 3-d-old seedlings described in (A) (left panel for each treatment), bar = 1 mm, and FESEM micrographs of hypocotyl epidermis (right panel for each treatment), bar = 25 μm.
Figure 2
Figure 2
Effects of gibberellic acid (GA) on degree of esterification (DE%) in WT (Ler), ga1-3 and gai hypocotyl cell walls. (A) Hypocotyl length at time of excision in 3-d-old seedlings. Measurements are an average of 40 to 90 hypocotyls ± SE for each genotype and treatment. (B) Uronic acid content and methyl ester content (measured as methanol) in walls of hypocotyls in (A). Each assay was performed on 50 to 100 hypocotyls for each genotype/treatment and repeated at least once in each experiment. Each experiment was performed three times. Amount of uronic acid and methanol was converted to nmol per hypocotyl in each replicate assay and the total values pooled. Measurements are the average of 6 to 9 replicates ± SE for each genotype and treatment. (C) Degree of methyl-esterification (DE%) in walls of hypocotyls in (A). Values in (B) (including SE) were ratioed (methanol to uronic acid) to give DE%.
Figure 3
Figure 3
Growth kinetics and hypocotyl cell elongation in P5-3, PME01, and PME08 seedlings. Seedlings were grown in continuous light for 10 d with plates in a near vertical position and hypocotyl growth measured over this period. Measurements are an average taken from 12 to 20 seedlings ± SE for each time point. After 3 d seedlings were transferred to control medium, or induction medium containing 0.1% (v/v) ethanol. Arrows indicate time (5 d) at which hypocotyls were further analysed. (A) P5-3, (B) PME01, (C) PME08.
Figure 4
Figure 4
Transcriptional analysis of PME1 using RT-PCR. RNA was extracted from hypocotyls after 2 d growth on control/induction medium (arrows in Figure 3) and reverse transcribed. PME1 expression was detected using gene-specific primers to amplify a 932 bp product. Actin isoform 2-specific primers were used as controls. Lanes denote treatment, (-) no ethanol, and (+) 0.1% ethanol.

References

    1. Carpita NC, Gibeaut DM. Structural models of primary cell walls in flowering plants - consistency of molecular structure with the physical properties of the walls during growth. Plant J. 1993;3:1–30. doi: 10.1046/j.1365-313X.1993.00999.x. - DOI - PubMed
    1. McCann MC, Roberts K. Architecture of the primary cell wall. In: Lloyd C, editor. The Cytoskeletal Basis of Plant Growth and Form. London , Academic Press; 1991. pp. 109–129.
    1. Green PB. Organogenesis - a biophysical view. Annu Rev Plant Physiol Plant Molec Biol. 1980;31:51–82. doi: 10.1146/annurev.pp.31.060180.000411. - DOI
    1. Brummell DA, Lashbrook CC, Bennett AB. Plant endo-1,4-beta-D-glucanases - structure, properties, and physiological function. (Acs Symposium Series).Enzymatic Conversion of Biomass for Fuels Production. 1994;566:100–129.
    1. Fry SC, Smith RC, Renwick KF, Martin DJ, Hodge SK, Matthews KJ. Xyloglucan Endotransglycosylase, a new wall-loosening enzyme- activity from plants. Biochem J. 1992;282:821–828. - PMC - PubMed

Publication types

MeSH terms

LinkOut - more resources