Review
. 2007 Oct;118(10):2128-48.
doi: 10.1016/j.clinph.2007.04.019. Epub 2007 Jun 18.

Updating P300: an integrative theory of P3a and P3b

Affiliations
Review

Updating P300: an integrative theory of P3a and P3b

John Polich. Clin Neurophysiol. 2007 Oct.

Abstract

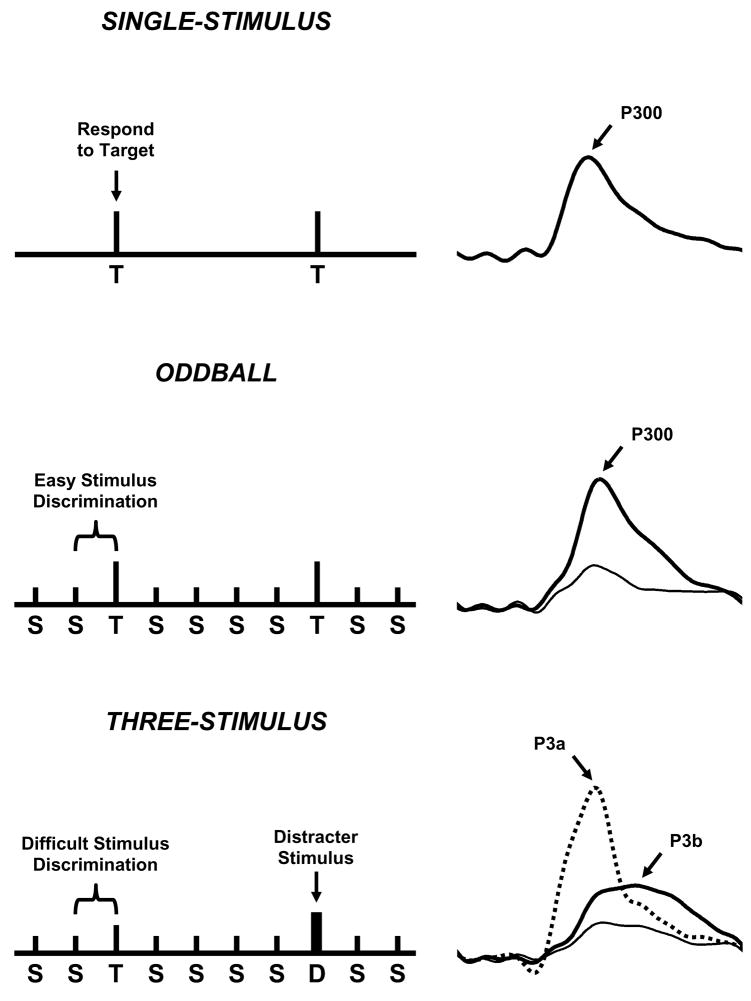
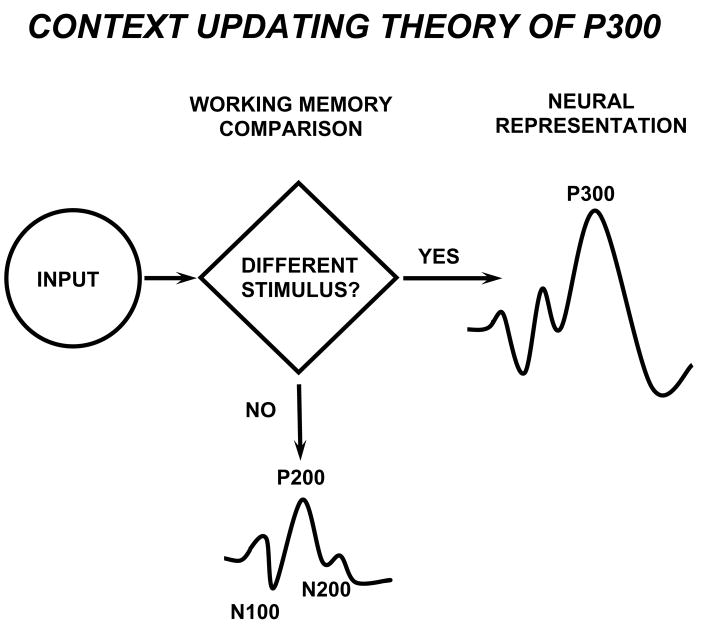
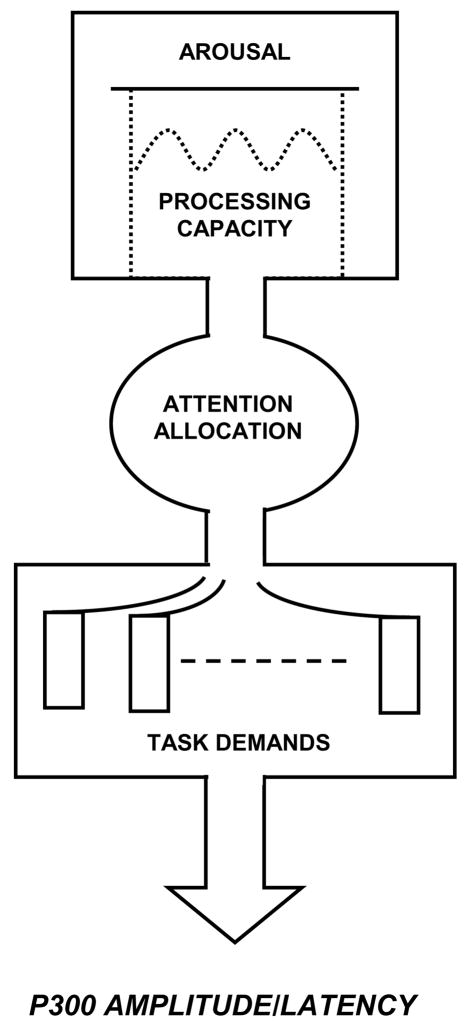
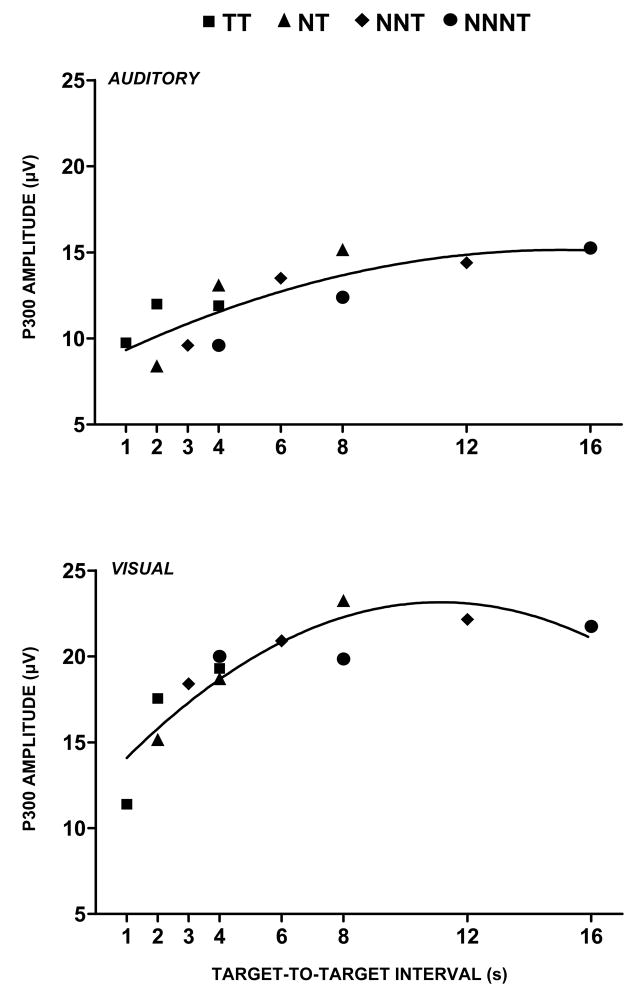
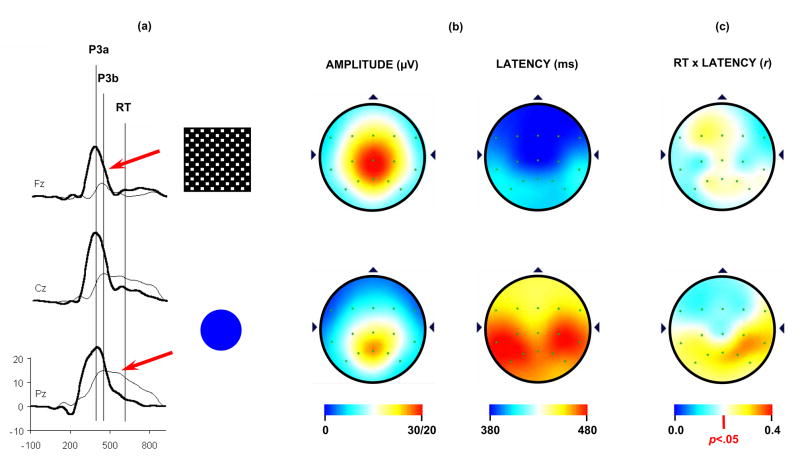
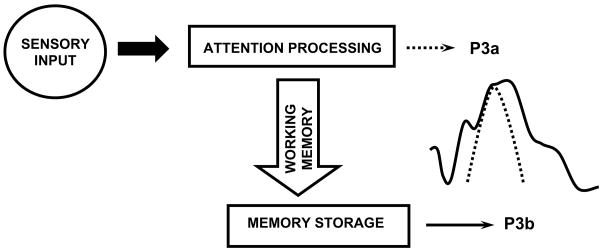
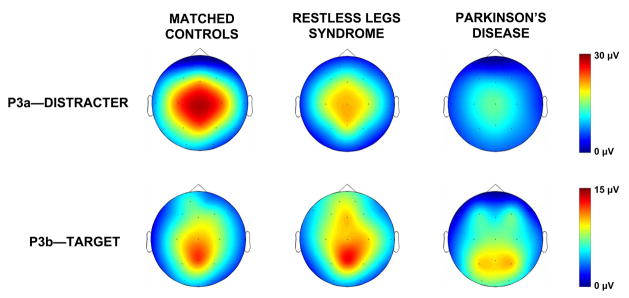
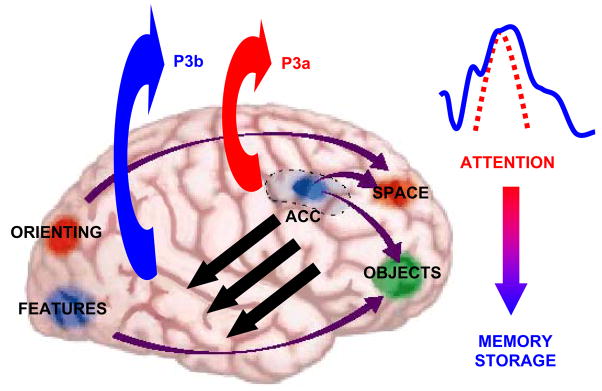
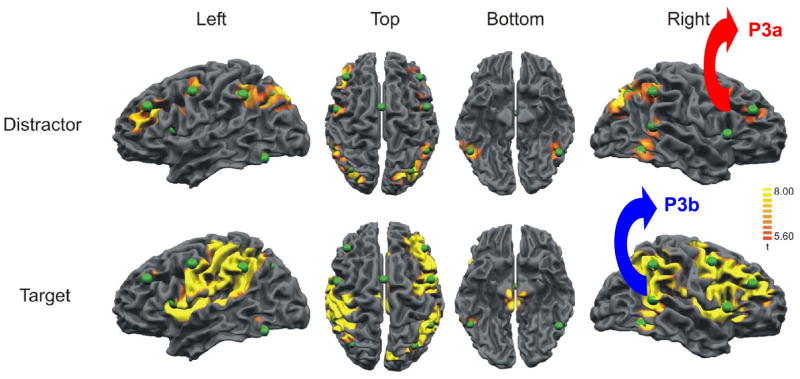
The empirical and theoretical development of the P300 event-related brain potential (ERP) is reviewed by considering factors that contribute to its amplitude, latency, and general characteristics. The neuropsychological origins of the P3a and P3b subcomponents are detailed, and how target/standard discrimination difficulty modulates scalp topography is discussed. The neural loci of P3a and P3b generation are outlined, and a cognitive model is proffered: P3a originates from stimulus-driven frontal attention mechanisms during task processing, whereas P3b originates from temporal-parietal activity associated with attention and appears related to subsequent memory processing. Neurotransmitter actions associating P3a to frontal/dopaminergic and P3b to parietal/norepinephrine pathways are highlighted. Neuroinhibition is suggested as an overarching theoretical mechanism for P300, which is elicited when stimulus detection engages memory operations.


Figures

Figure 1
Figure 1
Schematic illustration of the single-stimulus (top), oddball (middle), and three-stimulus (bottom) paradigms, with the elicited ERPs from the stimuli of each task at the right (Polich and Criado, 2006). The single-stimulus task presents an infrequent target (T) in the absence of any other stimuli. The oddball task presents two different stimuli in a random sequence, with one occurring less frequently than the other does (target=T, standard=S). The three-stimulus task is similar to the oddball with a compelling distracter (D) stimulus that occurs infrequently. In each task, the subject is instructed to respond only to the target and otherwise to refrain from responding. The distracter elicits a P3a, and target elicits a P3b (P300). Reprinted with permission of the authors and from Elsevier (Copyright 2006)
Figure 2
Figure 2
Schematic illustration of the P300 context-updating model (Polich, 2003). Stimuli enter the processing system and a memory comparison process is engaged that ascertains whether the current stimulus is either the same as the previous stimulus or not (e.g. in the oddball task, whether a standard or a target stimulus was presented). If the incoming stimulus is the same, the neural model of the stimulus environment is unchanged, and sensory evoked potentials (N100, P200, N200) are obtained after signal averaging. If the incoming stimulus is not the same and the subject allocates attentional resources to the target, the neural representation of the stimulus environment is changed or updated, such that a P300 (P3b) potential is generated in addition to the sensory evoked potentials. Reprinted with permission from Kluwer/Spring Publishing (Copyright 2003).
Figure 3
Figure 3
Schematic illustration of how attentional resources affect P300 (after Kahneman, 1973). This model reflects a general framework for viewing how attentional resources can affect P300 measures. Overall arousal level determines the amount of processing capacity available for attention allocation to on-going tasks. More difficult or multiple task demands reduce P300 amplitude and lengthen peak latency. Reprinted with permission from Academic Press (Copyright 1973).
Figure 4
Figure 4
P300 amplitude plotted as a function of target-to-target interval (TTI) for the target (T) stimulus in an oddball task across sequences of preceding nontarget (N) standard stimuli. The legend defines the symbols used to depict various nontarget and target sequences. The subject is instructed to respond only to the target stimulus. P300 amplitude increases independently of local sequence and global target probability. The regression lines reflect curvilinear best fit for a second order polynomial. Similar results have been found for the single-stimulus paradigm when only target stimuli are presented (Gonsalvez et al., 2007). Adapted from Gonsalvez and Polich (2002) with permission of the authors and Blackwell Publishing (Copyright 2002)
Figure 5
Figure 5
(a) Grand averages of the P3a, P3b, and response time (RT) from a three-stimulus oddball task (N=120). Subjects were instructed to press a button whenever an infrequent target (5.0 cm diameter) circle was detected in a series of standard (4.5 cm diameter) stimuli (not shown). Infrequently presented distracter checkerboard patterns (18 cm2) were employed to elicit the P3a. (b) Topography distributions for the mean P3a (upper) and P3b (lower) amplitude and latency. Note the distinct patterns for amplitude and latency from each component. Amplitude scales on upper end (30/20) refers to GV for P3a and P3b, respectively. (c) Topographic distributions of the correlation between P3a (top) and P3b (lower) latency and response time. The subject responded only to the target stimuli. P3a and response time were moderately correlated, whereas P3b and response time were strongly correlated over parietal areas. Adapted from Conroy and Polich (2007) with permission of the authors and Hogrefe & Huber Publishers (Copyright 2007)
Figure 6
Figure 6
Topographic amplitude mappings from the distracter and target stimuli (after Poceta et al., 2006). Each subject in the three groups of unaffected matched control, restless leg syndrome, and Parkinson’s disease patients performed the same task (see Figure 6). The patients were matched on age, gender, and education with n=7 individuals per group. The P3a amplitudes illustrate increasing dopaminergic deficits from left to right; the P3b amplitudes demonstrated little difference between controls and the restless leg syndrome patients, with Parkinson’s disease patients demonstrating appreciably smaller amplitudes.
Figure 7
Figure 7
Schematic model of cognitive P300 activity (Polich, 2003). Sensory input is processed, with frontal lobe activation from attention-driven working memory changes producing P3a and temporal/parietal lobe activation from memory updating operations producing P3b. Reprinted with permission from Kluwer/Spring Publishing (Copyright 2003).
Figure 8
Figure 8
Schematic representation of brain activation patterns underlying P3a and P3b generation (after Gazzaniga et al., 2000). The model suggests that stimulus information is maintained in frontal lobe working memory and monitored by anterior cingulate structures. When focal attention for the standard stimulus is disrupted by the detection of a distracter or a target (stimuli that garner attention automatically or purposefully from task demands), the P3a is perhaps generated by the activation pattern of the anterior cingulate and related structures. The attention-driven neural activity signal may be transmitted to temporal-parietal areas. Memory-related storage operations are engaged and P3b is generated via temporal/parietal cortical structures. As indicated by the ERP waveform and arrow to the right, every “P300” is composed of the P3a and P3b subcomponents, but the resulting ERP scalp topographies vary with the stimulus and task conditions that elicit them. Reprinted with permission from W.W. Norton & Company (Copyright, 2000).
Figure 9
Figure 9
Brain activation patterns from a visual three-stimulus oddball task modeled after that described in Figure 6 used with fMRI and EEG recordings (after Bledowski et al., 2004). Arrows and labels have been added to the images on the right for emphasis. The green spheres reflect dipole generator sources and appeared on the original figure. Reprinted with permission of the Society for Neuroscience (Copyright 2004).
Figure 10
Figure 10
(a) Illustrations of non-novel blue-square distracter and novel distracter stimuli used in a three-stimulus oddball task (after Demiralp et al., 2001). Both squares were relatively large (18 cm2) and presented on a monitor. Blue-squares were always the same stimulus, whereas the novel stimuli varied in form and color across trials. (b) Topographic distributions of the grand average P3a components (μV) from the blue-square and novel distracter stimuli. (c) Time-frequency wavelet analysis representation of the blue square and novel distracter stimuli. The amplitudes of the wavelet coefficients are encoded in color, with brighter colors indicating greater spectral power. Circles indicate theta activity. Reprinted with permission from Springer Publishers (Copyright, 2001).
Figure 11
Figure 11
Upper panel: Mean alpha power plotted against P300 amplitude (after Intriligator and Polich, 1994). Lower panel: Mean alpha frequency plotted against P300 latency. EEG was collected with eyes open. ERP data were elicited using an auditory oddball task (n=24). Reprinted with permission from Elsevier (Copyright 1994).
Figure 12
Figure 12
Upper panel: Illustration of event-related synchronization (ERS) and event-related desynchronization (ERD) from stimulus-related alpha activity calculations obtained during and ERP auditory oddball task (after Yordanova et al., 2001). Lower panel: ERD latency plotted against P300 amplitude (left) and amplitude (right) from normal young adults. ERP data were elicited using an auditory oddball task. Reprinted with permission from Blackwell Publishing (Copyright 2001).

Comment in

  • P3b: towards some decision about memory.
    Verleger R. Verleger R. Clin Neurophysiol. 2008 Apr;119(4):968-70. doi: 10.1016/j.clinph.2007.11.175. Epub 2008 Jan 25. Clin Neurophysiol. 2008. PMID: 18222107 No abstract available.

Similar articles

Cited by

References

    1. Ademoglu A, Demiralp T, Yordanova J, Kolev V, Devrim M. Decomposition of event-related brain potentials into multicomponents using wavelet transform. App Signal Process. 1998;5:142–151.
    1. Ademoglu A, Micheli-Tzanakou E, Istefanopulos Y. Analysis of pattern reversal visual evoked potentials (PRVEP’s) by spline wavelets. IEEE Trans Biomed Eng. 1997;44:881–890. - PubMed
    1. Alexander J, Bauer L, Kuperman S, Morzorati S, O’Connor S, Rohrbaugh J, Porjesz B, Begleiter H, Polich J. Hemispheric differences for P300 amplitude from an auditory oddball task. Int J Psychophysiol. 1996;21:189–196. - PubMed
    1. Alexander J, Polich J. P300 differences between sinistrals and dextrals. Cogn Brain Res. 1995;2:277–282. - PubMed
    1. Alexander J, Polich J. Handedness and P300 from auditory stimuli. Brain Cogn. 1997;35:259–270. - PubMed

Publication types

MeSH terms

Substances