Comparative Study
. 2007 Jun 15:8:174.
doi: 10.1186/1471-2164-8-174.

Comparative chloroplast genomics: analyses including new sequences from the angiosperms Nuphar advena and Ranunculus macranthus

Affiliations
Comparative Study

Comparative chloroplast genomics: analyses including new sequences from the angiosperms Nuphar advena and Ranunculus macranthus

Linda A Raubeson et al. BMC Genomics. .

Abstract

Background: The number of completely sequenced plastid genomes available is growing rapidly. This array of sequences presents new opportunities to perform comparative analyses. In comparative studies, it is often useful to compare across wide phylogenetic spans and, within angiosperms, to include representatives from basally diverging lineages such as the genomes reported here: Nuphar advena (from a basal-most lineage) and Ranunculus macranthus (a basal eudicot). We report these two new plastid genome sequences and make comparisons (within angiosperms, seed plants, or all photosynthetic lineages) to evaluate features such as the status of ycf15 and ycf68 as protein coding genes, the distribution of simple sequence repeats (SSRs) and longer dispersed repeats (SDR), and patterns of nucleotide composition.

Results: The Nuphar [GenBank:NC_008788] and Ranunculus [GenBank:NC_008796] plastid genomes share characteristics of gene content and organization with many other chloroplast genomes. Like other plastid genomes, these genomes are A+T-rich, except for rRNA and tRNA genes. Detailed comparisons of Nuphar with Nymphaea, another Nymphaeaceae, show that more than two-thirds of these genomes exhibit at least 95% sequence identity and that most SSRs are shared. In broader comparisons, SSRs vary among genomes in terms of abundance and length and most contain repeat motifs based on A and T nucleotides.

Conclusion: SSR and SDR abundance varies by genome and, for SSRs, is proportional to genome size. Long SDRs are rare in the genomes assessed. SSRs occur less frequently than predicted and, although the majority of the repeat motifs do include A and T nucleotides, the A+T bias in SSRs is less than that predicted from the underlying genomic nucleotide composition. In codon usage third positions show an A+T bias, however variation in codon usage does not correlate with differences in A+T-richness. Thus, although plastome nucleotide composition shows "A+T richness", an A+T bias is not apparent upon more in-depth analysis, at least in these aspects. The pattern of evolution in the sequences identified as ycf15 and ycf68 is not consistent with them being protein-coding genes. In fact, these regions show no evidence of sequence conservation beyond what is normal for non-coding regions of the IR.


Figures

Figure 1
Figure 1
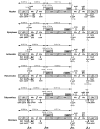
Linearized Nuphar advena plastome map. Genes are represented by boxes extending above or below the base line depending on the direction of transcription. The color of the gene boxes and the intergenic regions indicates the level of similarity of the region between the Nuphar and Nymphaea plastomes.
Figure 2
Figure 2
Circular Ranunculus macranthus plastome map. Genes are represented by boxes inside or outside the circle to indicate the direction of transcription, clockwise or counterclockwise, respectively. The color of the gene boxes indicates the functional group to which the gene belongs.
Figure 3
Figure 3
Comparison of inverted repeat-single copy boundaries in six representative angiosperms. Variation occurs at each of the four junctions. In Calycanthus rpl2 is not in the IR. JSB occurs within ycf1 in all of the genomes but the amount of the 5' end of ycf1 that is duplicated ranges from 156 bp in Nymphaea to 1583 bp in Amborella. Eleven bp of ndhF is duplicated in Nuphar but none of the other genomes shown have any duplication of the gene. JLA varies from including 5 bp of spacer downstream of trnH in Nicotiana to the inclusion of trnH and an additional 140 bp upstream sequence in the IR in Nuphar.
Figure 4
Figure 4
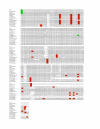
Alignment of the ycf15 region in six representative angiosperms. Atropa and Nicotiana represent the uninterrupted form. Codons highlighted in green represent start codons as annotated in the published genomes Atropa and Nicotiana. Codons highlighted in red represent stop codons in frame with those start codons. Although the sequence is highly conserved, it is not an open reading frame in most taxa.
Figure 5
Figure 5
Alignment of the ycf68 region in 14 representative angiosperms. Amborella, Nuphar, Zea, and Spinacia represent the form that includes intervening sequence. Codons highlighted in green represent start codons as annotated in the published grass genomes (Zea, Saccharum, Oryza and Triticum) and Nymphaea. Gorymekin et al identified a later start codon in their annotation of the Nymphaea ycf68 in order to maintain an open reading frame. Codons highlighted in red represent in frame stop codons (in frame with the grass start codon in the initial part of the alignment and in frame with the Nymphaea start codon once that point is reached). In either frame, these sequences, although largely conserved at the nucleotide level, are not open in most taxa.
Figure 6
Figure 6
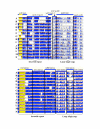
Sequence similarity comparisons of IGS and introns within the IR and the LSC. In both the top and bottom section, each 14 pairwise Mulan alignments is displayed as a histogram showing the similiarity (ranging from 50% to 100%) between each taxon (A-N) and the reference (Nicotiana top or Zea bottom). The height of the blue histogram topped by the horizontal black lines indicates the degree of similarity; similarity histograms are blue except where we have re-colored yellow the regions equivalent to ycf15 (top) and ycf68 (bottom) to highlight those regions. [The black horizontal lines without blue bars subtending them indicate short regions of similarity, basically SDRs. Red bars above the histogram indicate evolutionary conserved regions as determined in Mulan.] In interpreting the diagram, essentially the more blue (or yellow) in a region, the more similar are the two sequences. (Top) Comparisons, relevant to the conservation of ycf15, of six IGS regions from Nicotiana tobaccum were made to Calycanthus floridus (A), Amborella trichopoda (B), Zea mays (C), Saccharum officinarum (D), Phalaenopsis aphrodite (E), Lotus japonicus (F), Acorus calamus (G), Arabidopsis thaliana (H), Spinacia oleracea (I), Oenothera elata (J), Eucalyptus globulus (K), Nymphaea alba (L), Nuphar advena (M), and Ranunculus macranthus (N). (Bottom) Comparisons, relevant to the conservation of ycf68, of introns from Zea mays were made to those of Ranunculus macranthus (A), Calycanthus floridus (B), Eucalyptus globulus (C), Lotus japonicus (D), Spinacia oleracea (E), Phalaenopsis aphrodite (F), Nuphar advena (G), Nymphaea alba (H), Arabidopsis thaliana (I), Nicotiana tobaccum (J), Oenothera elata (K), Amborella trichopoda (L), Acorus calamus (M), and Saccharum officinarum (N).
Figure 7
Figure 7
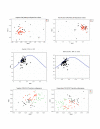
Graphical analyses of codon usage patterns. (top) Plots of the two most significant axes generated by the COA of RSCU values for Nuphar (top left) and Ranunculus (top right). Each point represents one of the 59 degenerate codons. The points are coded S (black circle) if the 3rd position nucleotide is G or C, and W (red square) if the 3rd position nucleotide is A or T. (middle) Plots of ENc (effective number of codons) by GC3 (the percentage G + C at the 3rd position) for each of the 79 protein-coding genes in Nuphar (middle left) and Ranunculus (middle right). The line in each graph (middle left and right) indicates the relationship predicted if codon usage was determined solely by 3rd position composition. (bottom) Plots of the two most significant axes generated by COA on CU (codon usage) for genes in Nuphar (bottom left) and Ranunculus (bottom right). Each gene is categorized as related to photosynthesis (green diamonds), gene expression (black circles) or other (red squares).
Figure 8
Figure 8
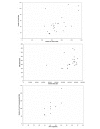
Scatter plots showing relationships between aspects of SSR frequency and other characteristics. (top) The relationship of "short" SSRs and "long" SSRs. "Long" SSRs are the 10,10.12 repeats. "Short" SSRs are the 8,8,9 repeats with the 10,10,12 repeats excluded. These are shown for the 24 taxa in Table 7. (middle) The relationship between total SSR number and genome size (in nucleotides) for the 24 taxa. (bottom) The relationship of A+T-richness (the overall A+T percentage of the genome) and the frequency of A and T mononucleotide repeats for the 10 taxa involved in the more detailed comparison. No other SSR category showed a relationship to any aspect of nucleotide composition.
Figure 9
Figure 9
The number of SDRs of different length classes found in eight different angiosperm plastid genomes. The majority of repeats are 40 nt or less in length, but some genomes so have repeats that are longer. Triticum, the only genome to have repeats over 100 nt in length, is also the only genome to exhibit inversions changing aspects of gene order from the angiosperm consensus order exhibited by Nicotiana (and the other genomes included.)

References

    1. Zanis MJ, Soltis DE, Soltis PE, Mathews S, Donoghue MJ. The root of the angiosperms revisited. Proc Nat Acad Sci USA. 2002;99:6848–6853. doi: 10.1073/pnas.092136399. [RMP15] - DOI - PMC - PubMed
    1. Stefanovic S, Rice DW, Palmer JD. Long branch attraction, taxon sampling, and the earliest angiosperm: Amborella or monocots? BMC Evol Biol. 2004;4:35. doi: 10.1186/1471-2148-4-35. - DOI - PMC - PubMed
    1. Goremykin VV, Holland B, Hirsch-Ernst KI, Hellwig FH. Analysis of Acorus calamus chloroplast genome and its phylogenetic implications. Mol Biol Evol. 2005;22:1813–1822. doi: 10.1093/molbev/msi173. - DOI - PubMed
    1. Leebens-Mack J, Raubeson LA, Cui L, Kuehl J, Fourcade M, Chumley T, Boore JL, Jansen RK, dePamphilis CW. Identifying the basal angiosperms in chloroplast genome phylogenies: Sampling one's way out of the Felsenstein zone. Mol Biol Evol. 2005;22:1948–1963. doi: 10.1093/molbev/msi191. - DOI - PubMed
    1. Chang C-C, Lin H-C, Lin I-P, Chow T-Y, Chen H-H, Chen W-H, Cheng C-H, Lin C-Y, Liu S-M, Chang C-C, Chaw S-M. The chloroplast genome of Phalaenopsis aphrodite (Orchidaceae): Comparative analysis of evolutionary rate with that of grasses and its phylogenetic implications. Mol Biol Evol. 2006;23:279–291. doi: 10.1093/molbev/msj029. - DOI - PubMed

Publication types

Associated data