. 2007 Jun 15;129(6):1081-95.
doi: 10.1016/j.cell.2007.03.055.

Rb regulates interactions between hematopoietic stem cells and their bone marrow microenvironment

Affiliations

Rb regulates interactions between hematopoietic stem cells and their bone marrow microenvironment

Carl R Walkley et al. Cell. .

Abstract

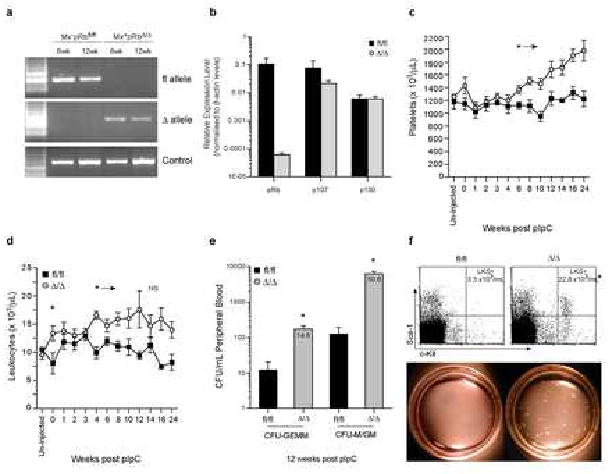
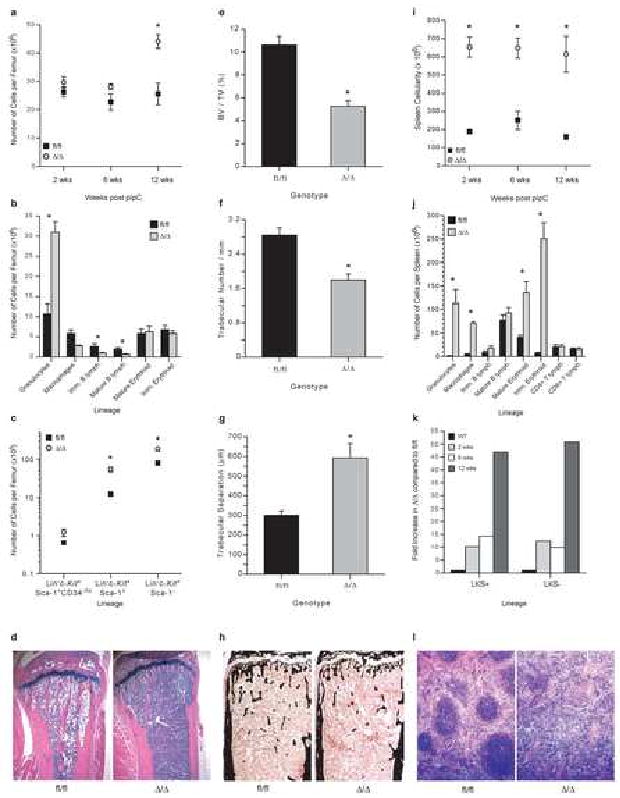
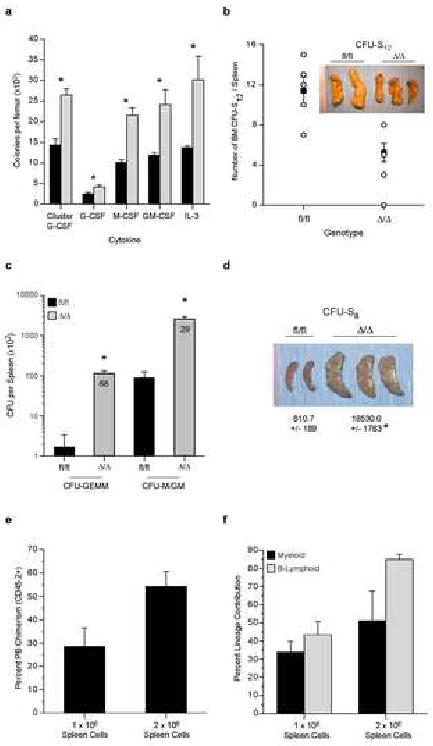
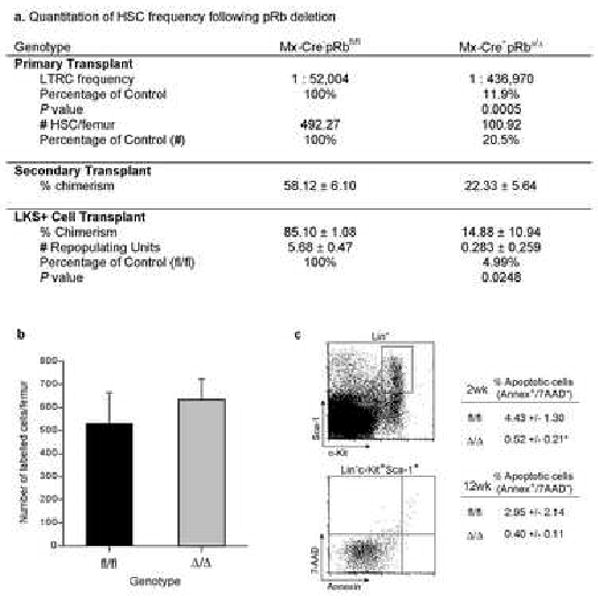
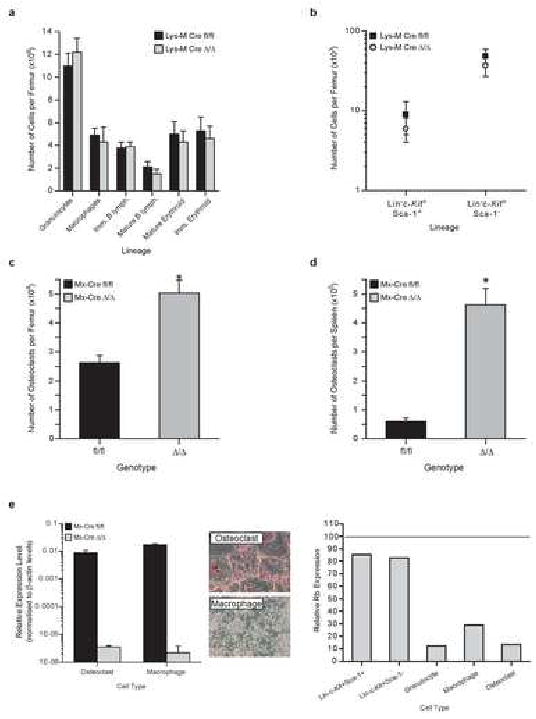
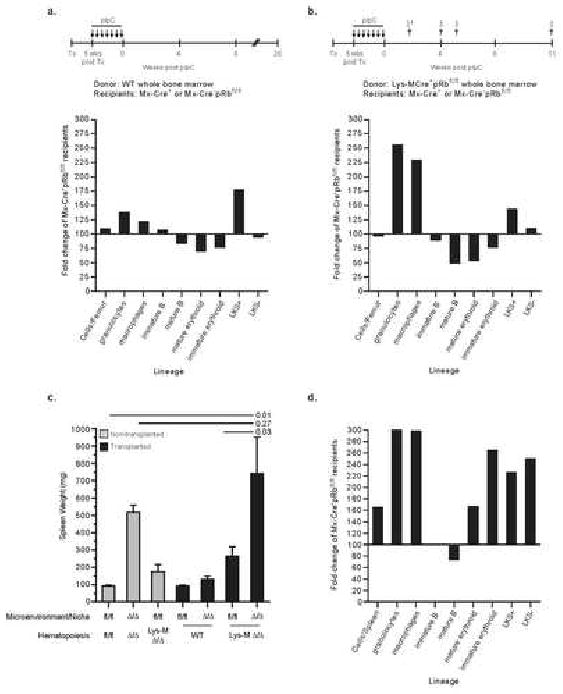
Hematopoiesis is maintained by stem cells (HSCs) that undergo fate decisions by integrating intrinsic and extrinsic signals, with the latter derived from the bone marrow (BM) microenvironment. Cell-cycle regulation can modulate stem cell fate, but it is unknown whether this represents an intrinsic or extrinsic effector of fate decisions. We have investigated the role of the retinoblastoma protein (RB), a central regulator of the cell cycle, in hematopoiesis. Widespread inactivation of RB in the murine hematopoietic system resulted in profound myeloproliferation. HSCs were lost from the BM due to mobilization to extramedullary sites and differentiation. This phenotype was not intrinsic to HSCs, but, rather, was the consequence of an RB-dependent interaction between myeloid-derived cells and the microenvironment. These findings demonstrate that myeloproliferation may result from perturbed interactions between hematopoietic cells and the niche. Therefore, RB extrinsically regulates HSCs by maintaining the capacity of the BM to support normal hematopoiesis and HSCs.


Conflict of interest statement

Conflict of Interest Statement: Authors have no conflicts of interest to declare pertaining to this research.

Figures

Figure 1
Figure 1
Rapid Mobilization of Primitive Cells into the Peripheral Blood following Deletion of Rb. A) Genomic PCR on whole BM from control (Mx-pRbfl/fl) and Rb deficient animals (Mx+pRbΔ/Δ) at 6 and 12 wks post-pIpC. B) qRT-PCR for pRb, p130 and p107 on cDNA of control and Rb deficient animals (n=3 independent samples) 12 wks post-pIpC. C) Platelets and D) Leukocytes in PB following Rb deletion (time 0 = final dose of pIpC); n≥4/time point; *P<0.05. e) Day 12 CFU-GEMM and CFU-GM/M from the PB of at 12 wks post-pIpC; n≥9/genotype; *P<0.01. Value inside bars represents fold increase. F) FACS profile and mean number of Lin-c-Kit+Sca-1+ (LKS+) in the PB; n>4/genotype; *P<0.01. Methylcellulose plates from day 12 of culture. Data expressed as mean ± SEM.
Figure 2
Figure 2
Myeloproliferation following Rb deletion. A) Femoral cellularity, n≥3/genotype/time point. B) Number of cells of each lineage/femur at 12 wks post pIpC; Granulocytes CD11b+Gr-1+, Macrophages CD11b+F4/80+, Immature B lymphoid IgM-B220+, Mature B lymphoid IgM+B220+, Mature Erythroid CD71-Ter119+, Immature Erythroid CD71+Ter119+; n≥8/genotype; *P<0.01. C) Number of phenotypic HSCs (LKS+CD34-/lo) and primitive progenitors/femur; 12 wks post pIpC; n≥5/genotype; *P<0.05. D) Representative sections of tibiae at 12 wks post pIpC. E) Volume of marrow space occupied by bone (BV/TV); 2 wks post pIpC; n≥13/genotype; *P<0.05. F) Trabecular number/mm; *P<0.05. G) Separation of trabeculae; *P<0.05. H) Representative longitudinal sections of tibiae stained with Von Kossa technique (mineralised bone stained black). I) Spleen cellularity; n≥3/genotype/time point; *P<0.01. J) Number of cells of each lineage/spleen; 12 wks post pIpC; n≥8/genotype; *P<0.01. K) Fold change in phenotypic LKS+ and LKS- in the spleen; n≥3/genotype/time point; P<0.05. L) Representative spleen sections (12 wks post pIpC). Unless noted all data expressed as mean ± SEM.
Figure 3
Figure 3
Increase in Progenitors in the Bone Marrow and HSCs/Progenitors in the Spleen of RbΔ/Δ Animals. A) Number of day 7 CFC per femur; n≥5/genotype/time point; *P<0.05. B) Number of CFU-S12 from 1 × 10⁵ whole BM cells; n=5/genotype. C) Splenic Day 12 CFU-GEMM and CFU-GM/M at 12 wks post-pIpC; n≥9/genotype; *P<0.01. Value inside bars is fold increase. D) CFU-S8/spleen; n=5/genotype; P<0.05. E) Percent PB chimerism at 17 wks post transplant from either 1 × 10⁶ or 2 × 10⁶ whole spleen cells from RbΔ/Δ animals 8 wks post pIpC with 2 × 10⁵ WT BM cells; n=5/genotype. F) Lineage contribution of spleen derived HSCs at 17 wks. Data expressed as mean ± SEM.
Figure 4
Figure 4
Loss of HSCs from the Bone Marrow Following Rb Deletion. A) HSC frequency and absolute number/femur; n=4-5 recipients/cell dose/genotype; experiment performed twice; data pooled from 2 independent experiments for calculation of HSC frequency. Primary transplant data from 6 mths post transplant. Secondary transplant data from 3 mths post transplant. 1000 freshly isolated LKS+ were transplanted and RU calculated 6 mths post transplant; n=5 recipients/cell dose/genotype. B) Number of CFDA-SE labelled cells in the BM of recipients 16 hours after injection; BM from 12 wks post pIpC; n=5 recipients/genotype. C) Apoptotic cells in the LKS+ and LKS- populations; n=9/genotype; P<0.05. Data expressed as mean ± SEM.
Figure 5
Figure 5
Myeloid Restricted Rb deletion Does Not Result in a Myeloproliferation. A) BM analysis; n≥6/genotype. B) Phenotypic primitive progenitors/femur; n≥6/genotype. C) Number of osteoclasts/femur; 6 wks post pIpC; n=3/genotype. D) Number of osteoclasts/spleen; 6 wks post pIpC; n=3/genotype. E) Rb excision analysis of osteoclasts and macrophages derived from either Mx-Cre mutants of Lysozyme-M-Cre-pRbfl/fl mutants; n≥3/genotype. Representative photographs of osteoclast and macrophage cultures (original magnification 10×).
Figure 6
Figure 6
A pRb dependent interaction between myeloid cells and the bone marrow microenvironment causes myeloproliferation A) Wild-type BM was transplanted into un-excised Mx-Cre-pRbfl/fl and Mx-Cre+pRbfl/fl recipients and 5 wks post transplant recipients received pIpC. Recipients were analyzed at 8- (n=3/genotype) and 20-wks (n=4/genotype) post pIpC. Data expressed as fold change of Mx+ recipients compared to Mx-Cre-pRbfl/fl recipients (normalized to 100%). Data shown from 8-wks post pIpC (comparable results at 20-wks). B) Sex mismatched Lysozyme-M-Cre+pRbfl/fl BM was transplanted into un-excised Mx-Cre-pRbfl/fl and Mx-Cre+pRbfl/fl recipients and 5 wks post transplant pIpC was administered. Data expressed as fold change of Mx+ recipients compared to Mx-Cre-pRbfl/fl recipients (normalized to 100%). † = approximate time of analysis post pIpC; n=11 Mx-Cre+ recipients in three independent experiments (2 found dead 2 weeks post pIpC); n=10 Mx-Cre- control recipients. C) Comparison of spleen weights amongst groups. D) Splenic hematopoiesis in Mx-Cre+pRbfl/fl recipients of Lysozyme-M-Cre+pRbfl/fl bone marrow. Data expressed as fold change compared to Mx-Cre-pRbfl/fl recipients (normalized to 100%).

References

    1. Adams GB, Chabner KT, Alley IR, Olson DP, Szczepiorkowski ZM, Poznansky MC, Kos CH, Pollak MR, Brown EM, Scadden DT. Stem cell engraftment at the endosteal niche is specified by the calcium-sensing receptor. Nature. 2006;439:599–603. - PubMed
    1. Adams GB, Scadden DT. The hematopoietic stem cell in its place. Nat Immunol. 2006;7:333–337. - PubMed
    1. Allinen M, Beroukhim R, Cai L, Brennan C, Lahti-Domenici J, Huang H, Porter D, Hu M, Chin L, Richardson A, et al. Molecular characterization of the tumor microenvironment in breast cancer. Cancer Cell. 2004;6:17–32. - PubMed
    1. Anderson ARA, Weaver AM, Cummings PT, Quaranta V. Tumor Morphology and Phenotypic Evolution Driven by Selective Pressure from the Microenvironment. Cell. 2006;127:905–915. - PubMed
    1. Arai F, Hirao A, Ohmura M, Sato H, Matsuoka S, Takubo K, Ito K, Koh GY, Suda T. Tie2/angiopoietin-1 signaling regulates hematopoietic stem cell quiescence in the bone marrow niche. Cell. 2004;118:149–161. - PubMed

Publication types

Substances