. 2007 Jun 15;129(6):1097-110.
doi: 10.1016/j.cell.2007.05.014.

A microenvironment-induced myeloproliferative syndrome caused by retinoic acid receptor gamma deficiency

Affiliations

A microenvironment-induced myeloproliferative syndrome caused by retinoic acid receptor gamma deficiency

Carl R Walkley et al. Cell. .

Abstract

Myeloproliferative syndromes (MPS) are a heterogeneous subclass of nonlymphoid hematopoietic neoplasms which are considered to be intrinsic to hematopoietic cells. The causes of MPS are largely unknown. Here, we demonstrate that mice deficient for retinoic acid receptor gamma (RARgamma), develop MPS induced solely by the RARgamma-deficient microenvironment. RARgamma(-/-) mice had significantly increased granulocyte/macrophage progenitors and granulocytes in bone marrow (BM), peripheral blood, and spleen. The MPS phenotype continued for the lifespan of the mice and was more pronounced in older mice. Unexpectedly, transplant studies revealed this disease was not intrinsic to the hematopoietic cells. BM from wild-type mice transplanted into mice with an RARgamma(-/-) microenvironment rapidly developed the MPS, which was partially caused by significantly elevated TNFalpha in RARgamma(-/-) mice. These data show that loss of RARgamma results in a nonhematopoietic cell-intrinsic MPS, revealing the capability of the microenvironment to be the sole cause of hematopoietic disorders.


Figures
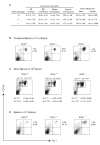
Figure 1
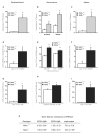
Figure 1. 8 week old RARγ-/- Mice have Elevated Numbers of Granulocytes
(A) Leukocyte cellularity in peripheral blood (PB), bone marrow (BM), spleen and thymus, in addition to body weights of 8 week old RARγ mutant mice. (B-D) Flow cytometric analysis of granulocytes and absolute numbers of granulocyte populations in 8 week old RARγ mutant mice: (B) Representative PB granulocyte FACS profiles, with the absolute numbers of granulocytes (× 103 cells/μl blood) shown to the right of each FACS profile. (C) Representative BM granulocyte FACS profiles, with the absolute numbers of immature granulocytes (Gr-1dim) and mature granulocytes (Gr-1bright; × 106 cells/femur) shown at the bottom of each FACS profile. (D) Representative spleen granulocyte FACS profiles, with the absolute numbers of granulocytes (× 107 cells/spleen) shown to the right of each FACS profile. Data are expressed as the mean ± SEM (n=6-9 per genotype). *P<0.05; #P<0.005 compared to RARγ+/+ mice (Student’s t-test).
Figure 2
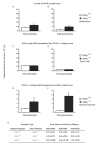
Figure 2. 8 Week Old RARγ-/- Mice Have Increased Numbers of Granulocyte Progenitors
(A) Numbers of 7 day GM-CSF- or SCF+G-CSF-responsive colony-forming cells formed per 5 × 10⁴ RARγ+/+ or RARγ-/- BM cells. (B) Numbers of 7 day G-CSF-responsive colony-forming cells formed per 5 × 10⁴ RARγ+/+ or RARγ-/- BM cells. (C) Numbers of 3 day G-CSF-responsive cluster-forming cells (Cl-FCs) formed per 5 × 10⁴ RARγ+/+ or RARγ-/- BM cells. (D) Numbers of 12 day CFU-GM formed per 1 × 10⁵ RARγ+/+ or RARγ-/- PB cells. (E) Numbers of 12 day CFU-GM formed per 1 × 10⁵ RARγ+/+ or RARγ-/- spleen (Sp) cells. (F) Numbers of 7 day G-CSF-responsive colony-forming cells generated per 5 × 10⁴ RARγ+/+ or RARγ-/- BM cells in response to submaximal and supramaximal concentrations of G-CSF. (G) Numbers of 7 day G-CSF-responsive colony-forming cells generated per 5 × 10⁴ RARγ+/+ or RARγ-/- BM cells in response to delayed addition (24 hours or 48 hours) of G-CSF to the cultures. (H) Frequencies of common myeloid progenitors (CMP), granulocyte macrophage progenitors (GMP) and megakaryocyte erythroid progenitors (MEPs) present in RARγ+/+ or RARγ-/- BM. Results are expressed as mean ± SEM, n=4 (A-C), n=3 (D-H). *P<0.05, #P<0.005 compared to RARγ+/+ (Student’s t-test).
Figure 3
Figure 3. 12 Month Old RARγ-/- Mice Have Profoundly Elevated Numbers of Mature and Immature Granulocytes and Progenitor Cells
(A) Numbers of PB granulocytes in 12 month old RARγ+/+ or RARγ-/- mice. (B) Numbers of immature and mature granulocytes in 12 month old RAR+/+ or RARγ-/- BM. (C) Numbers of granulocytes in 12 month old RARγ+/+ or RARγ-/- spleen. (D) Numbers of 12 day CFU-GEMM formed per 1 × 10⁵ RARγ+/+ or RARγ-/- PB cells. (E) Numbers of 7 day GM-CSF- or SCF + G-CSF-responsive colony-forming cells formed per 5 × 10⁴ RARγ+/+ or RARγ-/- BM cells. (F) Numbers of 12 day CFU-GEMM formed per 1 × 10⁵ RARγ+/+ or RARγ-/- spleen (Sp) cells. (G) Numbers of 12 day CFU-GM formed per 1 × 10⁵ RARγ+/+ or RARγ-/- PB cells. (H) Numbers of 7 day G-CSF-responsive colony-forming cells generated per 5 × 10⁴ RARγ+/+ or RARγ-/- BM cells. (I) Numbers of 12 day CFU-GM formed per 1 × 10⁵ RARγ+/+ or RARγ-/- spleen (Sp) cells. (J) B lymphocyte and erythroid content in BM of 12 month old RARγ+/+ or RARγ-/- mice. Results are expressed as mean ± SEM, n=4-8 (A-C, J), n=3 (D-I). *P<0.05, #P<0.005 compared to RARγ+/+ (Student’s t-test).
Figure 4
Figure 4. Ageing RARγ-/- Mice Exhibit a Profound Myeloproliferative-Like Disease. Representative sections of organs from 9-12 month old RARγ+/+ or RARγ-/- mice
(A-B) Hematoxylin and eosin stained sections of (A) RARγ+/+ or (B) RARγ-/- BM. Original magnification × 4. Identified are: trabecular bone (large arrows), cortical bone (arrowheads). (C-D) Hematoxylin and eosin stained sections of (C) RARγ+/+ or (D) RARγ-/- BM. Original magnification × 100. Identified are: megakaryocytes (large arrows), granulocytes (arrowheads). (E-F) Hematoxylin and eosin stained sections of (E) RARγ+/+ or (F) RARγ-/- adipose tissue. Original magnification × 20. (G) Higher power magnification of a section of RARγ-/- adipose tissue, stained with hematoxylin and eosin. Original magnification × 100. Identified are: megakaryocytes (large arrows), monocytes (double-headed arrows), erythroid cells (short arrows) and granulocytes (arrowheads). (H) Myeloperoxidase (MPO) stained section of RARγ-/- adipose tissue. Original magnification × 40. MPO-positive cells are brown.
Figure 5
Figure 5. RARγ-/- Mice Have a Microenvironment-Induced Myeloproliferative Syndrome
(A-B) Peripheral blood (A) leukocyte and (B) granulocyte counts in 8 week old RARγ+/+ and RARγ-/- mice. (C-D) Peripheral blood (C) leukocyte and (D) granulocyte counts in CD45.1+ congenic recipients transplanted with RARγ+/+ or RARγ-/- BM, 8 weeks post-transplant. (E-F) Peripheral blood (E) leukocyte and (F) granulocyte counts in RARγ+/+ or RARγ-/- recipients transplanted with CD45.1+ congenic BM, 5 weeks post-transplant. (G) B lymphocyte and erythroid content in BM of RARγ+/+ or RARγ-/- recipients transplanted with RARγ+/+ or RARγ-/- BM, 5-8 weeks post-transplant. Results are expressed as mean ± SEM, n=6 (A,B,G), n=4-6 (C-F, G). *P<0.05, #P<0.005 compared to RARγ+/+ (Student’s t-test).
Figure 6
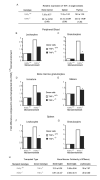
Figure 6. The Microenvironment-Induced Myeloproliferative Syndrome Observed in RARγ-/- Mice is Partially Due to Increased TNFα Signaling
(A) Relative expression of TNFα in cDNA from bone marrow, spleen and thymus extracts from 8 week old RARγ+/+ and RARγ-/- mice. (B-C) Fold-differences observed in peripheral blood (A) leukocyte and (B) granulocyte counts when TNFα+/+ or TNFα-/- BM was transplanted into RARγ+/+ compared to RARγ-/- recipient mice. (D-E) Fold-differences observed in BM (C) immature and (D) mature granulocyte counts when TNFα+/+ or TNFα-/- BM was transplanted into RARγ+/+ compared to RARγ-/- recipient mice. (F-G) Fold-differences observed in spleen (E) leukocyte and (F) granulocyte counts when TNFα+/+ or TNFα-/- BM was transplanted into RARγ+/+ compared to RARγ-/- recipient mice. (H) B lymphocyte and erythroid content in BM of RARγ+/+ or RARγ-/- recipients transplanted with TNFα-/- BM. The levels of expression of TNFα were quantified by Q-RT-PCR and are given as arbitrary units relative to β2-microglobulin. The data represent the mean ± SEM of three different samples for each genotype. #P<0.005 compared to RARγ+/+ (Student’s t-test). Numbers in parentheses indicate fold-differences in expression between RARγ+/+ and RARγ-/- organs. Transplant data are shown at 5-8 weeks post-transplant, n=4-6 recipients/group.
Figure 7
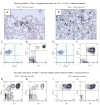
Figure 7. Absolute Requirement for an RARγ-/- Microenvironment to Sustain the Myeloproliferative-Like Disease
Shown are representative May-Grunwald Giemsa-stained PB smears of (A) an RARγ+/+ recipient and (B) an RARγ-/- recipient (with PB leukocyte cellularity >48 × 106 cells/ml), both transplanted with the same donor CD45.1+ congenic wildtype bone marrow. Identified are: normal granulocyte (large arrow), immature myeloid cells (arrowheads), abnormal erythrocytes (double-headed arrows). (C-D) FACS analysis of the RARγ+/+ recipient shows high levels of donor cell reconstitution (C) and normal granulocyte profiles (D) in the PB. (E-F) FACS analysis of the RARγ-/- recipient shows high levels of donor cell reconstitution (E) and abnormal granulocyte profiles (F) in the PB. (G-H) Two representative FACS profiles of donor-derived PB granulocytes in secondary RARγ+/+ recipients transplanted with 2.5 × 10⁶ spleen leukocytes obtained from the primary RARγ-/- recipient whose PB parameters are shown in 7B, E and F. (I-J) Two representative FACS profiles of donor-derived PB granulocytes in secondary RARγ-/- recipients transplanted with 2.5 × 10⁶ spleen leukocytes obtained from the primary RARγ-/- recipient whose PB parameters are shown in 7B, E and F. Data are shown at 8 weeks post-transplant, n=3-5 ecipients/group

Comment in

References

    1. Akashi K, Traver D, Miyamoto T, Weissman IL. A clonogenic common myeloid progenitor that gives rise to all myeloid lineages. Nature. 2000;404:193–197. - PubMed
    1. Altucci L, Gronemeyer H. The promise of retinoids to fight against cancer. Nat Rev Cancer. 2001;1:181–193. - PubMed
    1. Araki T, Mohi MG, Ismat FA, Bronson RT, Williams IR, Kutok JL, Yang W, Pao LI, Gilliland DG, Epstein JA, Neel BG. Mouse model of Noonan syndrome reveals cell type- and gene dosage-dependent effects of Ptpn11 mutation. Nat Med. 2004;10:849–857. - PubMed
    1. Avecilla ST, Hattori K, Heissig B, Tejada R, Liao F, Shido K, Jin DK, Dias S, Zhang F, Hartman TE, et al. Chemokine-mediated interaction of hematopoietic progenitors with the bone marrow vascular niche is required for thrombopoiesis. Nat Med. 2004;10:64–71. - PubMed
    1. Balmer JE, Blomhoff R. Gene expression regulation by retinoic acid. J Lipid Res. 2002;43:1773–1808. - PubMed

Publication types

Substances