

High resolution multidetector CT-aided tissue analysis and quantification of lung fibrosis
- PMID: 17574128
- PMCID: PMC2701291
- DOI: 10.1016/j.acra.2007.03.009
High resolution multidetector CT-aided tissue analysis and quantification of lung fibrosis
Abstract
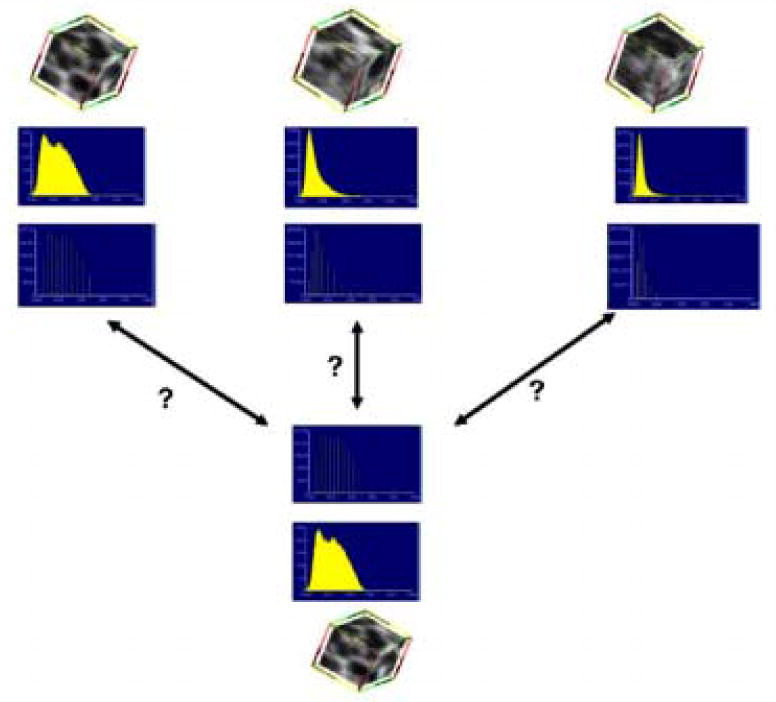
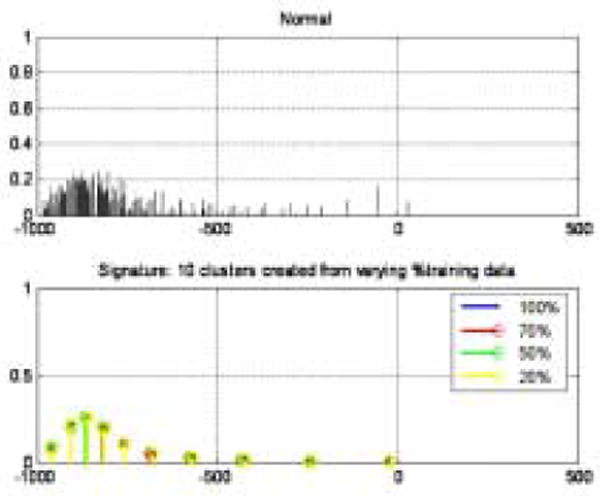
Rationale and objectives: Volumetric high-resolution scans can be acquired of the lungs with multidetector CT (MDCT). Such scans have potential to facilitate useful visualization, characterization, and quantification of the extent of diffuse lung diseases, such as usual interstitial pneumonitis or idiopathic pulmonary fibrosis (UIP/IPF). There is a need to objectify, standardize, and improve the accuracy and repeatability of pulmonary disease characterization and quantification from such scans. This article presents a novel texture analysis approach toward classification and quantification of various pathologies present in lungs with UIP/IPF. The approach integrates a texture matching method with histogram feature analysis.
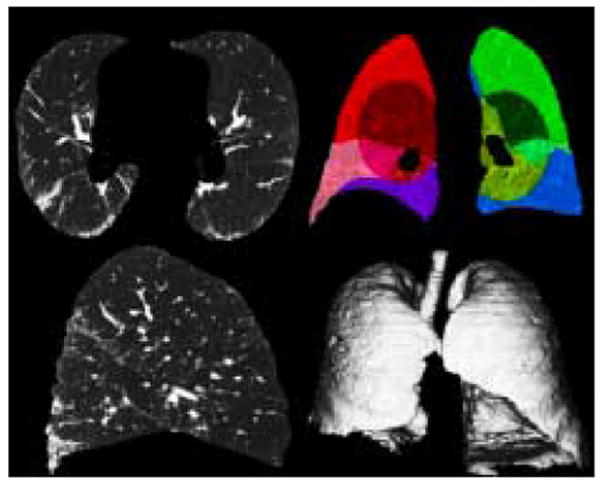
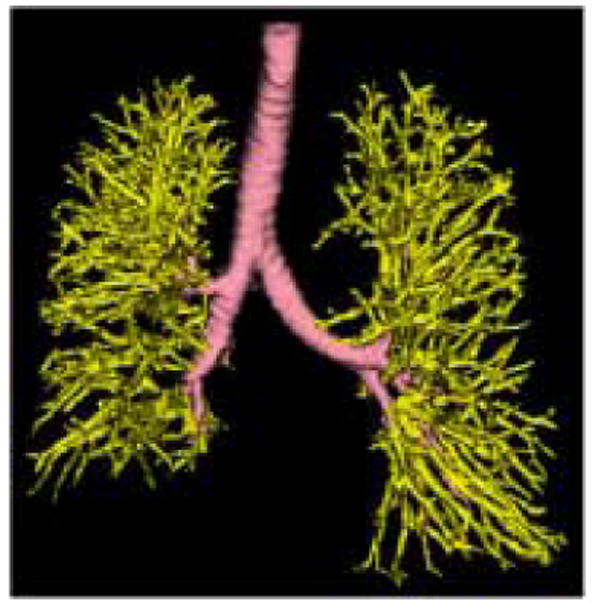
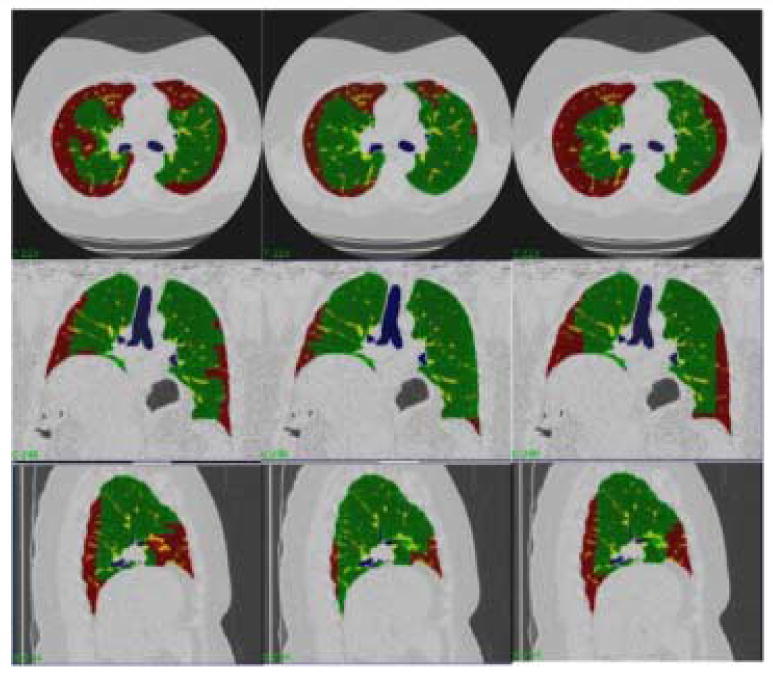
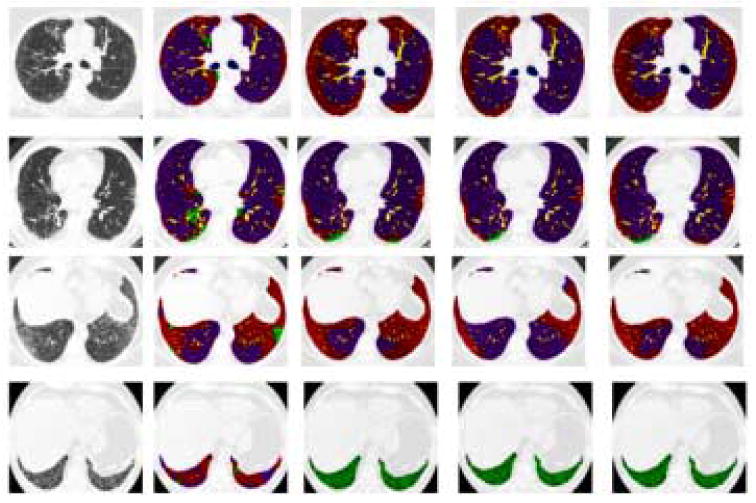
Materials and methods: Patients with moderate UIP/IPF were scanned on a Lightspeed 8-detector GE CT scanner (140 kVp, 250 mAs). Images were reconstructed with 1.25-mm slice thickness in a high-frequency sparing algorithm (BONE) with 50% overlap and a 512 x 512 axial matrix, (0.625 mm(3) voxels). Eighteen scans were used in this study. Each dataset is preprocessed and includes segmentation of the lungs and the bronchovascular trees. Two types of analysis were performed, first an analysis of independent volume of interests (VOIs) and second an analysis of whole-lung datasets. 1) Fourteen of the 18 scans were used to create a database of independent 15 x 15 x 15 cubic voxel VOIs. The VOIs were selected by experts as having greater than 70% of the defined class. The database was composed of: honeycombing (number of VOIs 337), reticular (130), ground glass (148), normal (240), and emphysema (54). This database was used to develop our algorithm. Three progressively challenging classification experiments were designed to test our algorithm. All three experiments were performed using a 10-fold cross-validation method for error estimation. Experiment 1 consisted of a two-class discrimination: normal and abnormal. Experiment 2 consisted of a four-class discrimination: normal, reticular, honeycombing, and emphysema. Experiment 3 consisted of a five-class discrimination: normal, ground glass, reticular, honeycombing, and emphysema. 2) The remaining four scans were used to further test the algorithm on new data in the context of a whole lung analysis. Each of the four datasets was manually segmented by three experts. These datasets included normal, reticular and honeycombing regions and did not include ground glass or emphysema. The accuracy of the classification algorithm was then compared with results from experts.
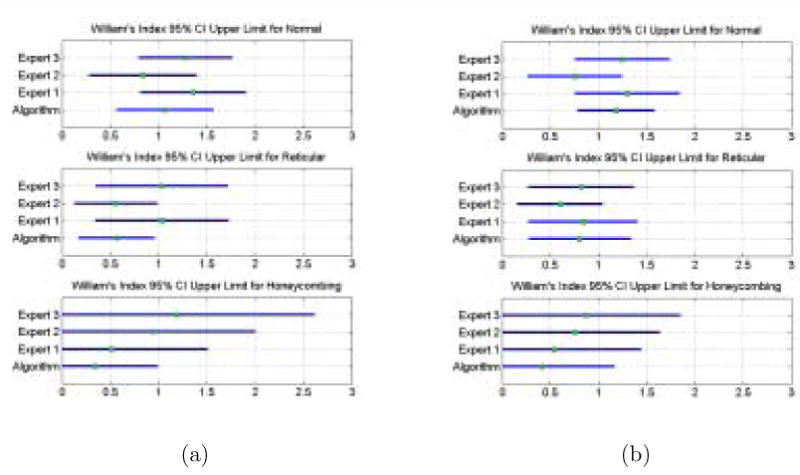
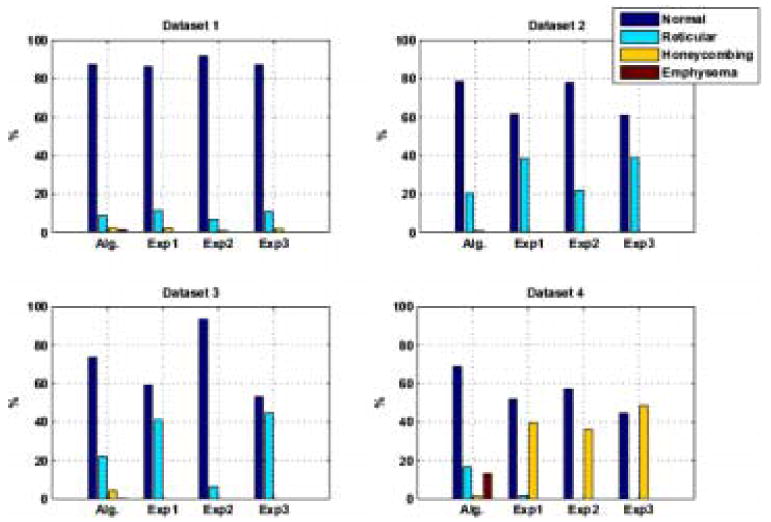
Results: Independent VOIs: 1) two-class discrimination problem (sensitivity, specificity): normal versus abnormal (92.96%, 93.78%). 2) Four-class discrimination problem: normal (92%, 95%), reticular (86%, 87%), honeycombing (74%, 98%), and emphysema (93%, 98%). 3) Five-class discrimination problem: normal (92%, 95%), ground glass (75%, 89%), reticular (22%, 92%), honeycombing (74%, 91%), and emphysema (94%, 98%). Whole-lung datasets: 1) William's index shows that algorithm classification of lungs agrees with the experts as well as the experts agree with themselves. 2) Student t-test between overlap measures of algorithm and expert (AE) and expert and expert (EE): normal (t = -1.20, P = .230), Reticular (t = -1.44, P = .155), Honeycombing (t = -3.15, P = .003). 3) Lung volumes intraclass correlation: dataset 1 (ICC = 0.9984, F = 0.0007); dataset 2 (ICC = 0.9559, F = 0); dataset 3 (ICC = 0.8623, F= 0.0015); dataset 4 (ICC = 0.7807, F = 0.0136).
Conclusions: We have demonstrated that our novel method is computationally efficient and produces results comparable to expert radiologic judgment. It is effective in the classification of normal versus abnormal tissue and performs as well as the experts in distinguishing among typical pathologies present in lungs with UIP/IPF. The continuing development of quantitative metrics will improve quantification of disease and provide objective measures of disease progression.
Figures


Comment in
-
2D or not 2D that is the question, but 3D is the answer.Acad Radiol. 2007 Jul;14(7):769-71. doi: 10.1016/j.acra.2007.05.008. Acad Radiol. 2007. PMID: 17574127 No abstract available.
References
-
- Beigelman-Aubry C, Hill C, Guibal A, Savatovsky J, Grenier PA. Multi-Detector row CT and postprocessing techniques in the assessment of diffuse lung disease. Radiographics. 2005;25(6):1639–1652. - PubMed
-
- Sutton RN, Hall EL. Texture measures for automatic classification of pulmonary disease. IEEE Transactions on Computers. 1972;21(7):667–676.
-
- Kruger RP, Thompson WB, Turner AF. Computer diagnosis of pneumoconiosis. IEEE Transactions on Systems, Man, and Cybernetics. 1974;4:40–49.
-
- Hall EL, William J, Crawford O, Roberts RE. Computer classification of pneumoconiosis from radiographs of coal workers. IEEE Transactions on Biomedical Engineering. 1975;22(6):518–527. - PubMed
-
- Turner AF, Kruger RP, Thompson WB. Automated computer screening of chest radiographs for pneumoconiosis. Investigative Radiology. 1976;11(4):258–266. - PubMed
MeSH terms
Grants and funding
LinkOut - more resources
Full Text Sources
Other Literature Sources
Medical
