Review
. 2007 Jul;41 Suppl 2(Suppl 2):S226-42.
doi: 10.1097/MCG.0b013e31803233b7.

The gastric H,K ATPase as a drug target: past, present, and future

Affiliations
Review

The gastric H,K ATPase as a drug target: past, present, and future

George Sachs et al. J Clin Gastroenterol. 2007 Jul.

Abstract

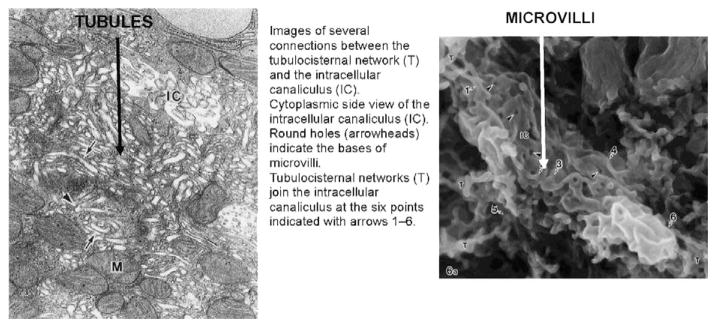
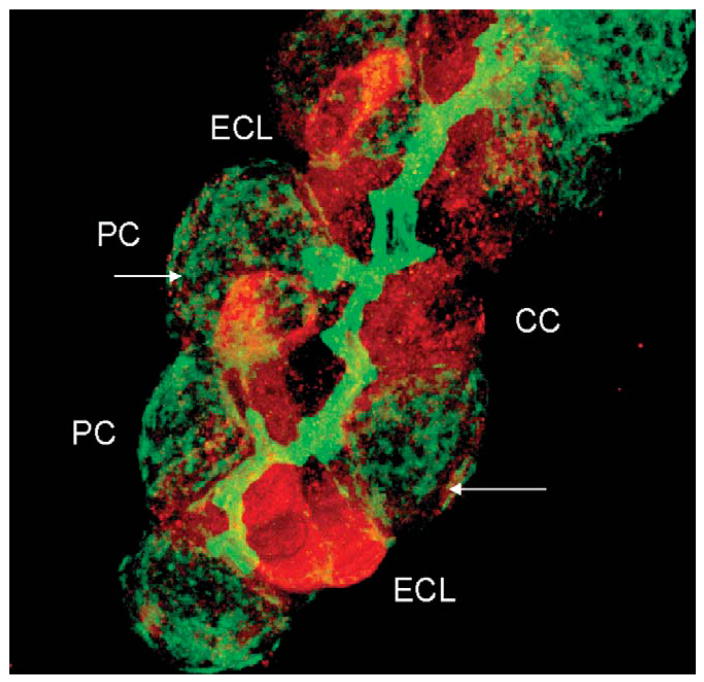
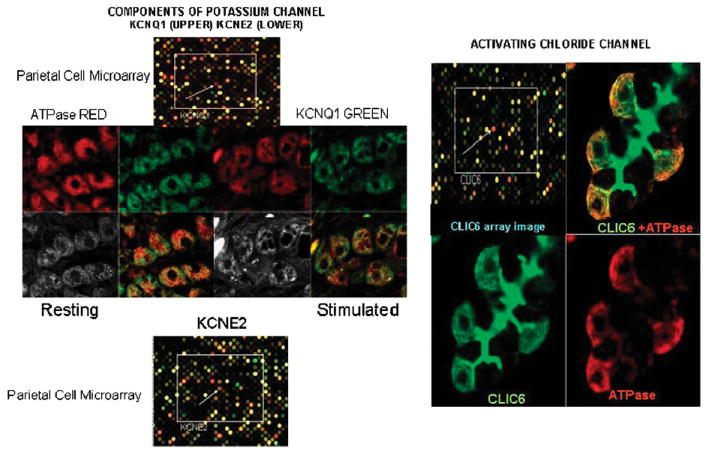
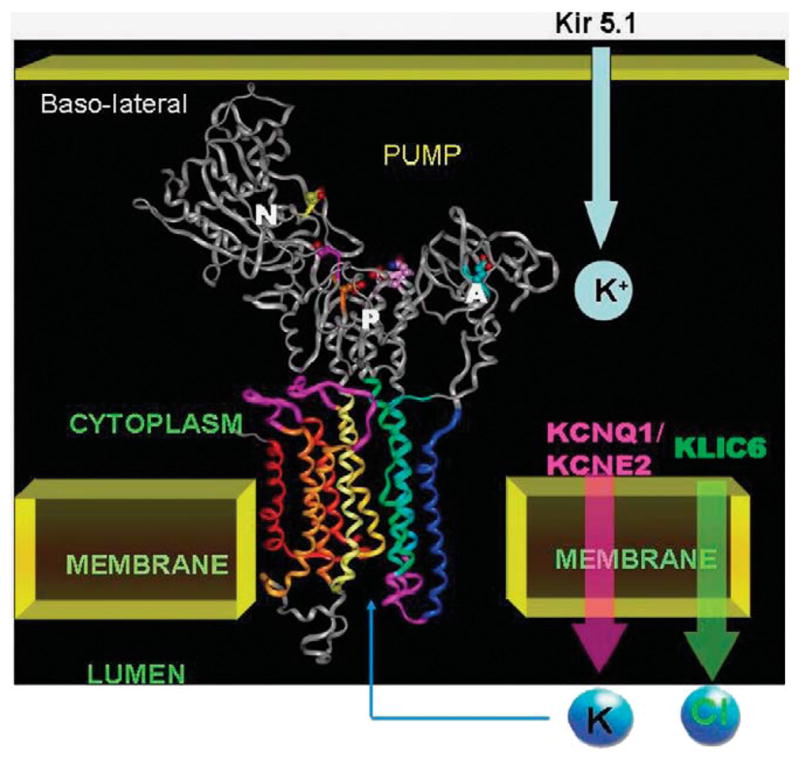
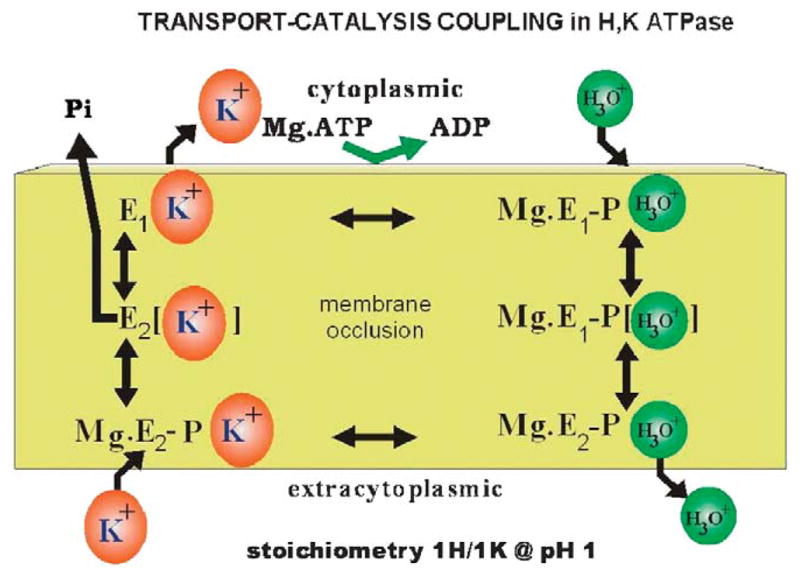
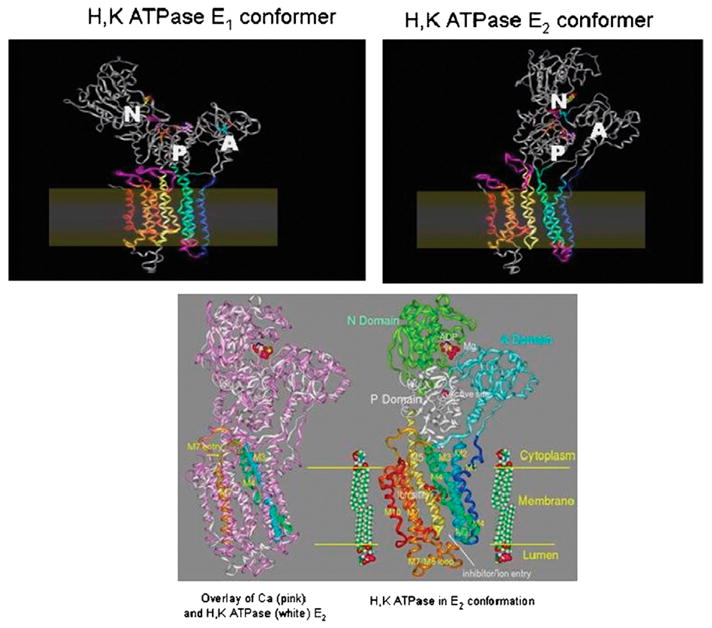
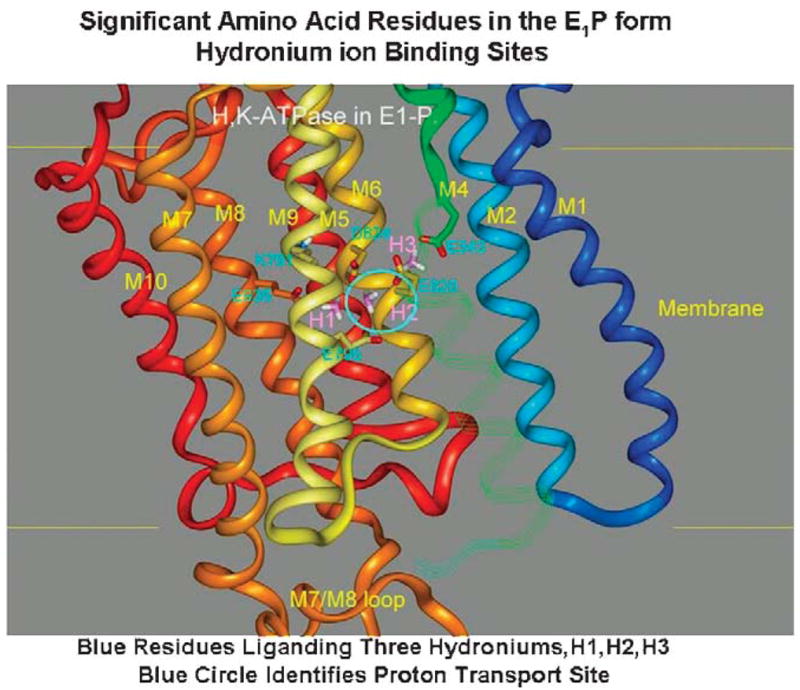
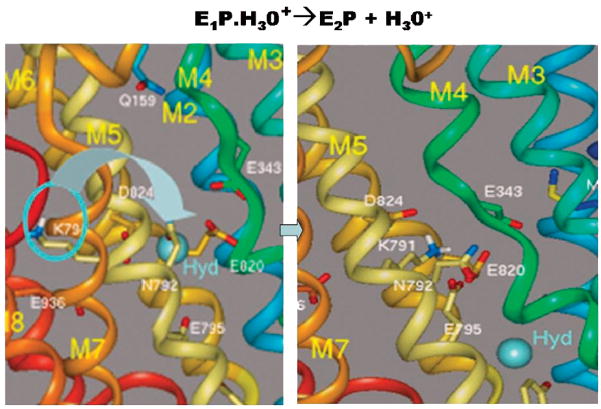
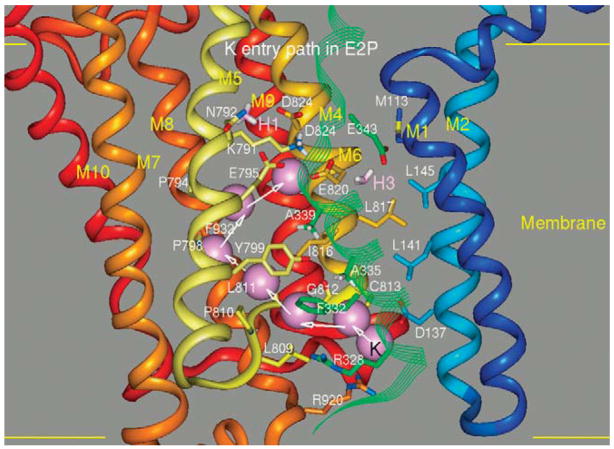
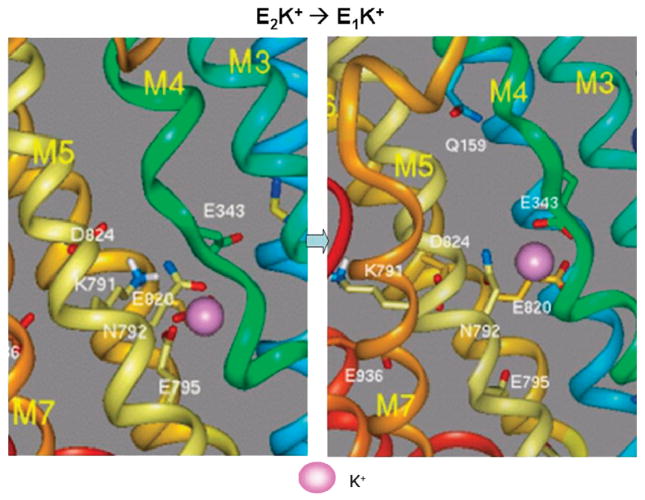
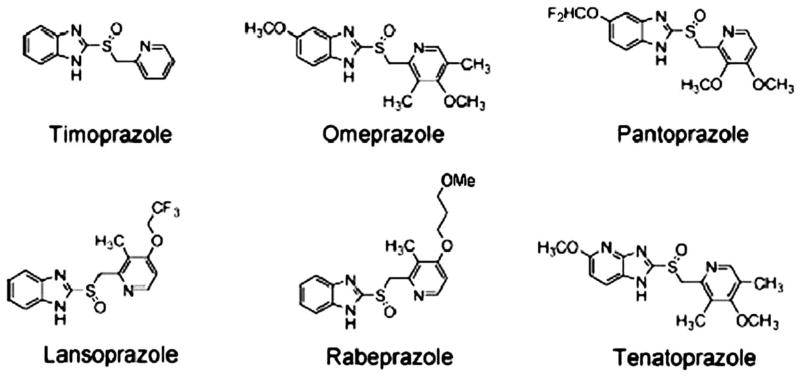
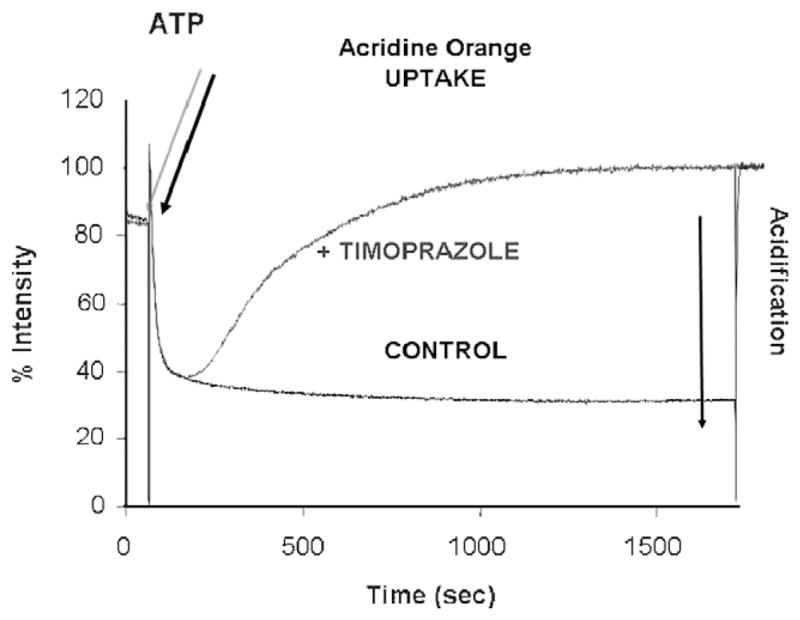
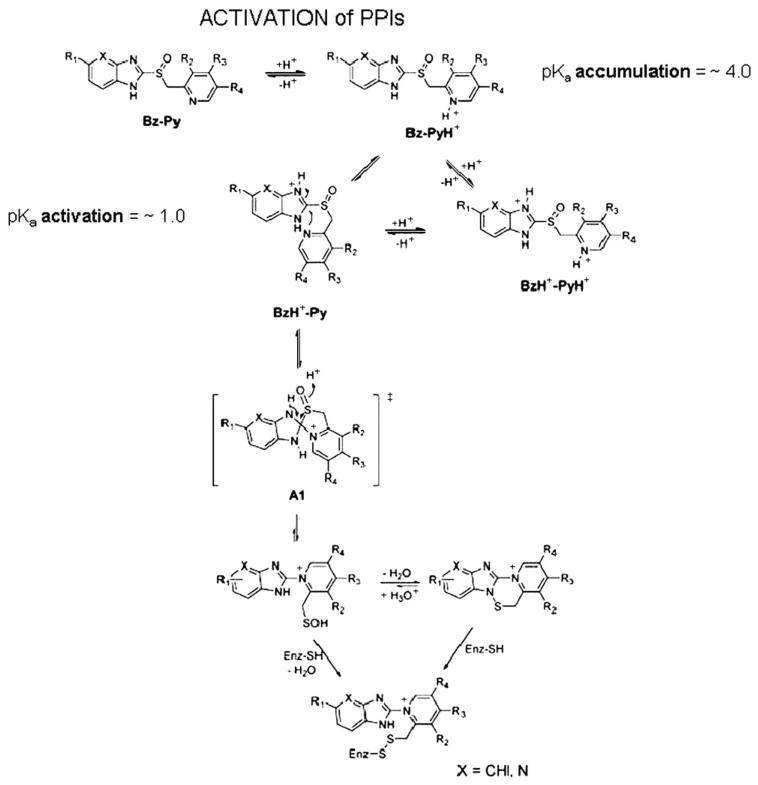
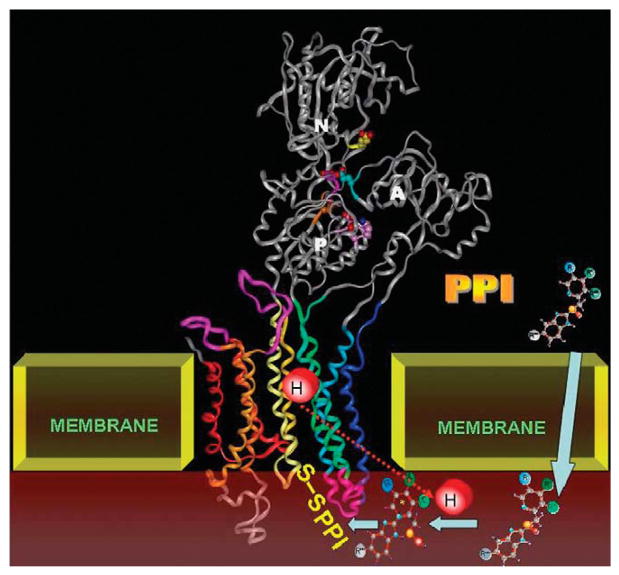
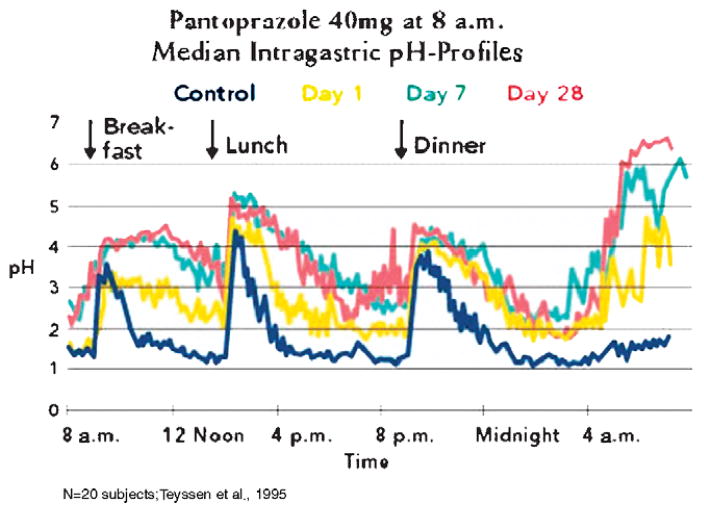
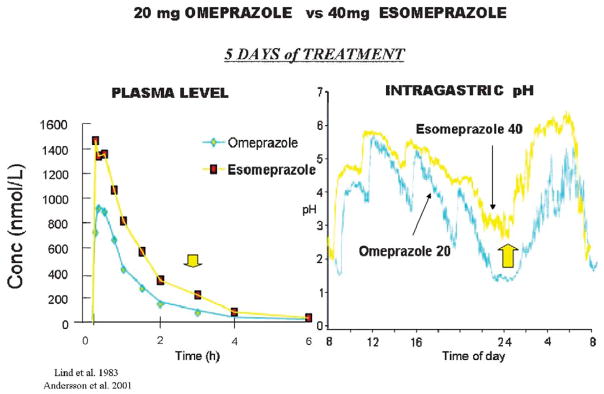
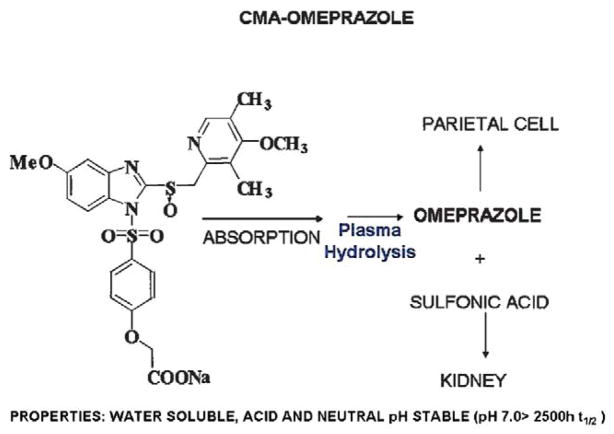
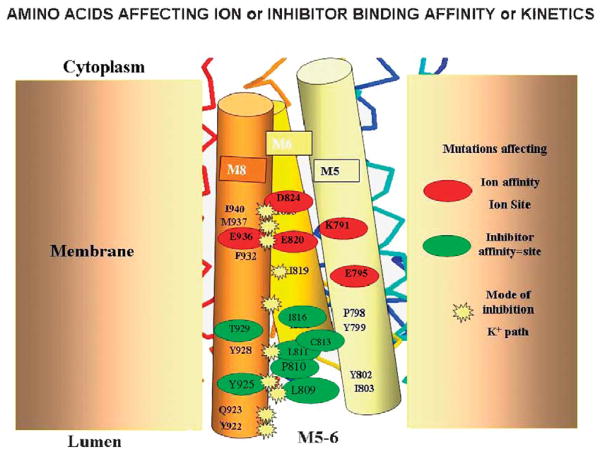
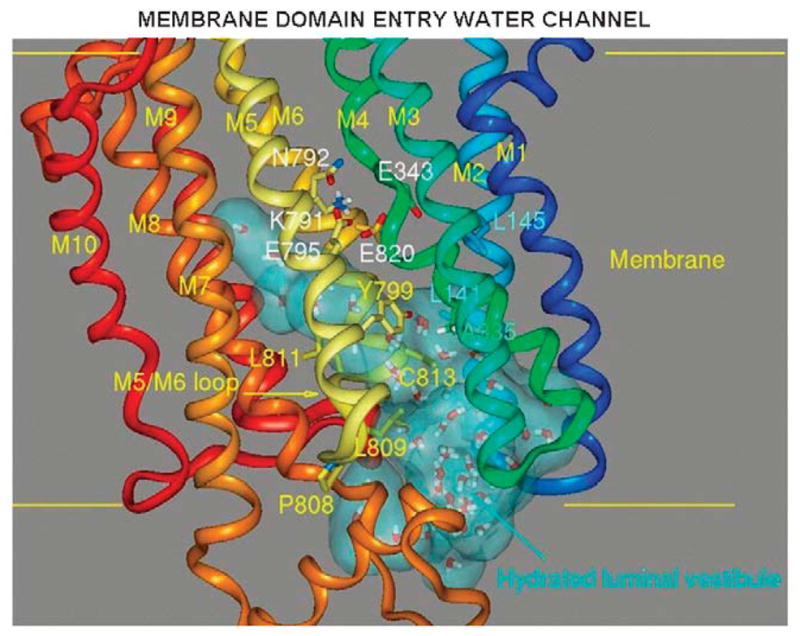
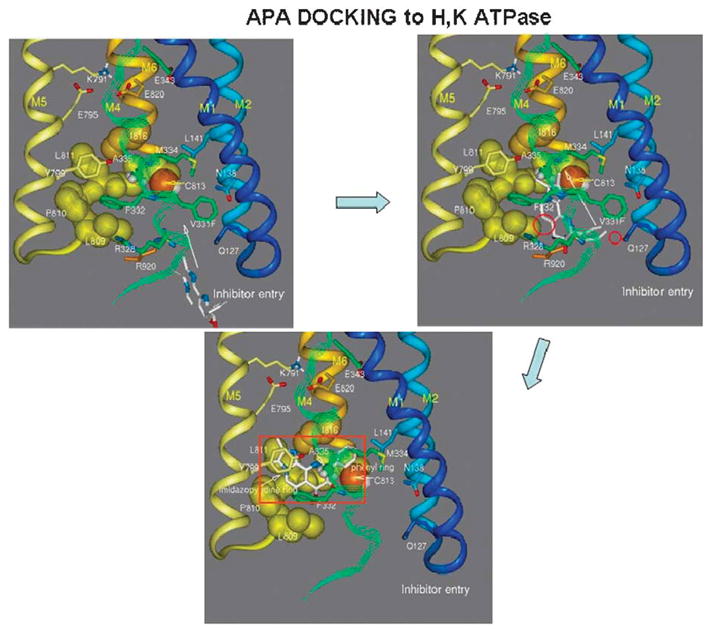
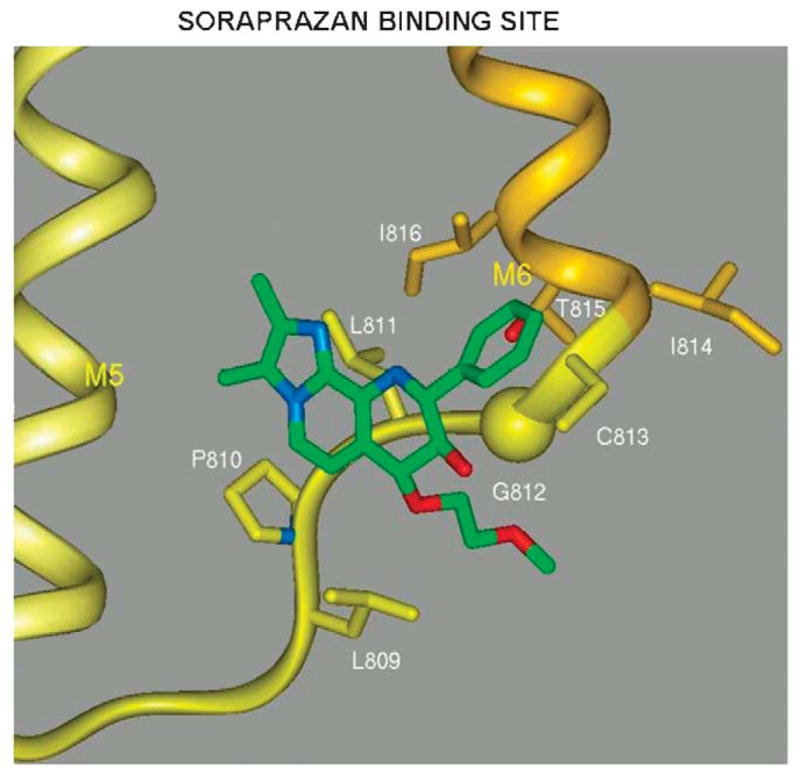
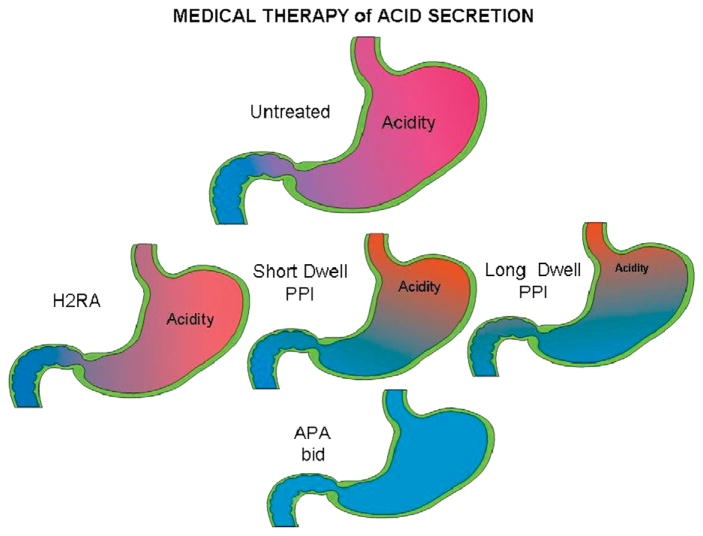
The recent progress in therapy if acid disease has relied heavily on the performance of drugs targeted against the H,K ATPase of the stomach and the H2 receptor antagonists. It has become apparent in the last decade that the proton pump is the target that has the likelihood of being the most sustainable area of therapeutic application in the regulation of acid suppression. The process of activation of acid secretion requires a change in location of the ATPase from cytoplasmic tubules into the microvilli of the secretory canaliculus of the parietal cell. Stimulation of the resting parietal cell, with involvement of F-actin and ezrin does not use significant numbers of SNARE proteins, because their message is depleted in the pure parietal cell transcriptome. The cell morphology and gene expression suggest a tubule fusion-eversion event. As the active H,K ATPase requires efflux of KCl for activity we have, using the transcriptome derived from 99% pure parietal cells and immunocytochemistry, provided evidence that the KCl pathway is mediated by a KCQ1/KCNE2 complex for supplying K and CLIC6 for supplying the accompanying Cl. The pump has been modeled on the basis of the structures of different conformations of the sr Ca ATPase related to the catalytic cycle. These models use the effects of site directed mutations and identification of the binding domain of the K competitive acid pump antagonists or the defined site of binding for the covalent class of proton pump inhibitors. The pump undergoes conformational changes associated with phosphorylation to allow the ion binding site to change exposure from cytoplasmic to luminal exposure. We have been able to postulate that the very low gastric pH is achieved by lysine 791 motion extruding the hydronium ion bound to carboxylates in the middle of the membrane domain. These models also allow description of the K entry to form the K liganded form of the enzyme and the reformation of the ion site inward conformation thus relating the catalytic cycle of the pump to conformational models. The mechanism of action of the proton pump inhibitor class of drug is discussed along with the cysteines covalently bound with these inhibitors. The review concludes with a discussion of the mechanism of action and binding regions of a possible new class of drug for acid control, the K competitive acid pump antagonists.


Figures

FIGURE 1
FIGURE 1
On the left is a transmission electron microscope of a resting parietal cell after hypertonic fixation with glutaraldehyde and on the right is a scanning electron micrograph of a resting cell after protein extraction leaving the lipid framework. The tubular appearance is clear in the right hand image, as is the tubulo-cisternal network with contact points to the intracellular canaliculus.
FIGURE 2
FIGURE 2
A confocal image of a rabbit gastric gland stained with antibody against F-actin (green) and SNAP 25 (red), showing the high levels of the latter in ECL cells known to exocytose histamine containing vacuoles and also high levels in chief (CC) or peptic cells that exocytose pepsinogen granules. Staining for SNAP 25 is very weak in parietal cells and largely on the basal surface of this cell as indicated by the arrows.
FIGURE 3
FIGURE 3
Illustrations of purified parietal cell compared with whole gastric epithelium microarray data and immunostaining of K and Cl channels in rabbit gastric glands. On the top left is the image of the microarray showing in red fluorescence the spot corresponding to KCNQ1 and on the bottom left the spot corresponding to KCNE2 where the red fluorescence indicates higher expression in the parietal cell transcriptome. In the middle, there is the confocal image of staining with anti-ATPase α subunit in red and against KCNQ1 in green, showing their localization in both resting and stimulated glands. On the right top right is the microarray image showing high expression of CLIC6 in the parietal cell and then immunostaining of CLIC6 and ATPase bottom images and a fused image top right. There appears to be some colocalization of the channels with the ATPase in the parietal cell but particularly intense staining for CLIC6 in the lumen of the gastric gland.
FIGURE 4
FIGURE 4
A model of the H,K ATPase on the basis of homology to the sr Ca ATPase in the E1 configuration that shall be discussed later shown the 3 cytoplasmic domains, N the nucleotide binding domain, P the phosphorylation domain, and A the actuator domain and the 10 transmembrane segments of the catalytic domain. The K+ entry path on the basolateral surface is postulated to be Kir5.1 that is highly expressed in parietal cells and the canalicular efflux pathways are the KCNQ1/KCNE2 complex for voltage independent K+ efflux and CLIC6 for Cl efflux. These pathways allow KCl efflux and followed by K+ for H+ exchange by the ATPase, net production of HCl.
FIGURE 5
FIGURE 5
The classic scheme of the catalytic steps involved in a IH+/1K+/ATP transport at pH~1.0, where the catalytic subunit of the enzyme is phosphorylated by Mg.ATP to form Mg.E1-P.H30+ that can reverse to reform ATP. This form transits the occluded conformation very rapidly to expose the H30+ site to the outside in the Mg.E2-P.H30+ form, allowing release of the hydronium to the outside. K+ then binds from this surface resulting in dephosphorylation of the catalytic subunit to form the transiently K+ occluded form, which converts to E1.K+ that releases K+ to the cytoplasm accelerated by binding of a fresh molecule of Mg.ATP. H30+ is likely transported rather than H+ since at alkaline pH the pump can transport Na+.
FIGURE 6
FIGURE 6
Homology models of the H,K and sr Ca ATPase: on the upper left is shown the model of the H,K ATPase in the E1 configuration with little interaction between the actuator (A) domain and the N or P domains. In the E2 conformation, the A domain is now in juxtaposition to the P and N domains with flexing of the M1 and M2 transmembrane segments and an apparent generation of a vestibule facing the lumen shown on the top right of the figure. The position of the membrane is shown in both upper images. On the bottom is the alignment of the H,K ATPase (white) with the sr Ca ATPase (pink) on the left hand side, showing correspondence in many regions and deviations of the homology model. Altered positions for transmembrane segments M3 and M4 (blue and green ribbons, respectively) are highlighted by lines representing the helix axes. The cytoplasmic entry into M7 (gold ribbon) is also changed. On the right is the image of the H,K ATPase in the E2 configuration, showing on the top the nucleotide and Mg binding region and in the middle of the membrane the ion binding carboxylic acids, both illustrated in ball and stick form.
FIGURE 7
FIGURE 7
A homology model of the ion binding domain of the gastric H,K ATPase in the E1-P conformation. The carboxylic acid residues in this region are shown in cyan and the 3 potential hydroniums are shown in stick form and labeled H1, H2, and H3 (purple). The colors of the transmembrane helices are maintained in all the figures. The continuation of the M4 segment is in strand form and the M3 strand is omitted so as to visualize the binding domain. The cyan circle highlights the H2 site, which we believe to be dominant in countertransport of H3O+ and K+ by the H,K ATPase.
FIGURE 8
FIGURE 8
The transport of H3O+ outward by the H,K ATPase depends on the substitution of this hydronium in the H2 position of Figure 7 by the NH3+ group of lysine 791 owing to the changes in the conformation of TM5 and is accompanied by a change in the conformation of TM4 as also seen in the sr Ca ATPase transition. The left hand image shows the original position of the lysine and the right hand image the motion of the lysine into the H2 site of Figure 7 with displacement of the hydronium (hyd) toward the luminal face of the pump.
FIGURE 9
FIGURE 9
The potassium entry pathway in the E2P conformation reaching the H2 binding domain displacing lysine 791 by binding glutamyls 795 and 820 is illustrated in Figure 7. As a result, the catalytic subunit dephosphorylates and the E2K form is generated before the transition to the E1K conformation.
FIGURE 10
FIGURE 10
The transition from E2K to the E1K conformation whereby K can exit from the cytoplasmic surface of the pump. In the left hand image K is liganded by the carboxylates of glutamyls 795 and 820 with displacement of lysine 791. In the right hand image, lysine 791 has returned to the E1 conformation as have M1 and M2 and K has moved into a site where the carboxylates of glutamyl 820 in M6 and glutamyl 343 in M4 are now binding the potassium, partially the H3 site illustrated in Figure 7. E343 in M4 now moves with the transition of M1 and M1 to the E1 conformation providing a cytoplasmic exit pathway for K+.
FIGURE 11
FIGURE 11
The core structure of the PPIs, timoprazole, followed by the 4 currently marketed PPIs and tenatoprazole with its imidazopyridine moiety substituting for the benzimidazole in the other PPIs.
FIGURE 12
FIGURE 12
The experiment showing that the PPI core structure is an acid activated prodrug. In black is shown the acidification inside ion-tight gastric vesicles upon the addition of Mg ATP in the presence of KCl and valinomycin with a maintained proton gradient for at least 1500 seconds. In the presence of timoprazole, the addition of Mg.ATP (blue arrow) resulted in the same rate of acid transport and hence acridine orange for only about 100 seconds and then the fluorescence quench reversed, showing inhibition of acid transport (blue line). The lag phase for inhibition is due to the requirement of acid activation of these benzimidazoles, converting them from their inactive prodrug form to the active drug that inhibits the ATPase.
FIGURE 13
FIGURE 13
The pathway for activation of the PPIs to result in inhibition of the H,K ATPase. The top line shows the pyridine protonation that is responsible for accumulation of the PPIs in the acid space of the stimulated parietal cell with a pH<4.0. This protonation is followed by protonation of the benzimidazole or imidazopyridine moiety with a pKa~1.0 and this happens as shown on the left second row. The protonation of this moiety results in activation of the 2C position and the formation of a spiro intermediate as shown in the brackets. This rearranges to form the sulfenic acid, which is a highly thiophilic reagent. It can dehydrate to form the sulfenamide on the right or react directly with cysteines accessible from the luminal (acidic) surface of the pump to form covalent disulfides with cysteines accessible from the lumen. The sulfenamide is also thiophilic and can also bind covalently to the enzyme.
FIGURE 14
FIGURE 14
A model showing the E2 structure of the pump to which the PPIs bind. During acid transport, the PPI becomes concentrated (arrows) in the secretory canaliculus (brown) and is then activated before binding to cysteines of the pump that are accessible from the lumen. Once bound to these the PPI forms a stable disulfide bond. There is some variation in stability, binding to cysteine 813 in the luminal vestibule of the pump can be reversed by the addition of glutathione, whereas binding to cysteine 822 cannot be reversed by this agent.,
FIGURE 15
FIGURE 15
A typical pH profile of PPI treatment, in this case with pantoprazole, once a day before breakfast. It can be seen in the yellow curve that there is already significant inhibition on the first day, but there is improvement in acid control by day 7 (blue) that is maintained until day 28 (red).
FIGURE 16
FIGURE 16
A comparison of once a day dosing between 20mg of omeprazole and 40mg of esomeprazole. The improved PK profile is shown on the left with an increase in the residence time in the blood (arrow). On the right is shown the improvement in the intragastric pH profile and the arrow shows the improvement in nighttime intragastric pH. The differences observed here required a large number of patients to show improvement in clinical outcome.
FIGURE 17
FIGURE 17
The structure of the CMA-omeprazole, AGN 904, that has undergone phase I development and has been tested in human volunteers showing a superior pH profile.
FIGURE 18
FIGURE 18
On the left is shown the usual absorption of omeprazole in the duodenum where with the short half-life and absence of drug, acid secretion can return. On the right, the absorption of CMA-omeprazole or any other CMA-PPI occurs along the length of the small intestine. The continuous intestinal absorption provides increased availability of the agent and results in prolonged exposure of the parietal cells to omeprazole with subsequent considerable improvement of pH control, particularly at night in comparison with omeprazole.
FIGURE 19
FIGURE 19
The structure of SCH28080, the forerunner of most of the APAs that are being developed in the center and on the left a series of analogs that have been tried in vivo and on the right the core structure of the fused ring compounds generated to mimic the active conformation of SCH28080 with the phenyl ring orthogonal to the imidazopyridine.
FIGURE 20
FIGURE 20
A model of the location of amino acids whose mutation altered NH4+ affinity (red oval), SCH28080 affinity (green oval), or changed inhibition from being purely competitive to either mixed or noncompetitive. The red ovals delineate the amino acids in the ion binding domain, the green ovals delineate amino acids whose mutation decrease APA inhibitor affinity, and the yellow stars delineate those amino acids whose mutation changes inhibition from purely competitive to either mixed or noncompetitive. These amino acids affect the ability of K+ to enter the ion binding site in the presence of SCH28080 hence changing competitive inhibition. The background stick molecule represents a scaled down version of the pump elements.
FIGURE 21
FIGURE 21
The entry path for SCH28080 generated by using the SOAK algorithm in the E2 configuration of the H,K ATPase model generated from the binding sites of ATPase inhibitors shown as a light blue cloud showing the presence of water of hydration. The path reaches all the way up to the H2 ion binding site of Figure 7.
FIGURE 22
FIGURE 22
A model of the entry of SCH28080 into the luminal domain of the H,K ATPase on the top left, the path taken in the upper right image and the final binding site is show in the bottom image. In this model, valine 331 is substituted by phenylalanine to allow generation of sufficient space to allow inhibitor entry and exit via the water channel shown in Figure 21.
FIGURE 23
FIGURE 23
A model of the docking of soraprazan to the region of the H,K ATPase that can also be occupied by SCH28080 as shown in Figure 22. Nonessential elements have been omitted for clarity.
FIGURE 24
FIGURE 24
A cartoon showing the progression of improvement in acid control, for the untreated stomach (top) and increasing acid control from left to right with H2 receptor antagonists, PPIs, long dwell time PPIs, and the anticipated effect of BID APAs or a CMA-PPI as an ideal goal.

References

    1. Marshall BJ, Warren JR. Unidentified curved bacilli in the stomach of patients with gastritis and peptic ulceration. Lancet. 1984;1:1311–1315. - PubMed
    1. Sachs G, Shin JM, Munson K, et al. Review article: the control of gastric acid and Helicobacter pylori eradication. Aliment Pharmacol Ther. 2000;14:1383–1401. - PubMed
    1. Black JW, Duncan WAM, Durant CJ, et al. Definition and antagonism of histamine H2 receptors. Nature. 1972;236:385–390. - PubMed
    1. Fellenius E, Berglindh T, Sachs G, et al. Substituted benzimidazoles inhibit gastric acid secretion by blocking (H+ + K+)ATPase. Nature. 1981;290:159–161. - PubMed
    1. Toyoshima C, Asahi M, Sugita Y, et al. Modeling of the inhibitory interaction of phospholamban with the Ca2+ ATPase. Proc Natl Acad Sci USA. 2003;100:467–472. - PMC - PubMed

Publication types

MeSH terms