. 2007;35(13):4420-32.
doi: 10.1093/nar/gkm453. Epub 2007 Jun 18.

Fine-tuning of intrinsic N-Oct-3 POU domain allostery by regulatory DNA targets

Affiliations

Fine-tuning of intrinsic N-Oct-3 POU domain allostery by regulatory DNA targets

Robert Alazard et al. Nucleic Acids Res. 2007.

Abstract

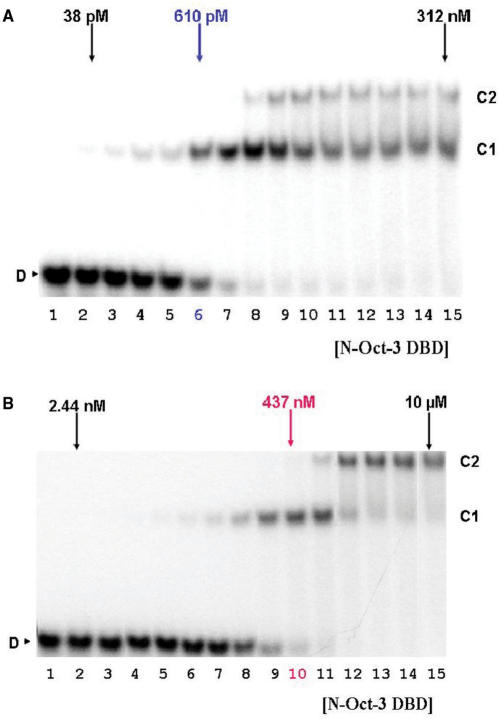
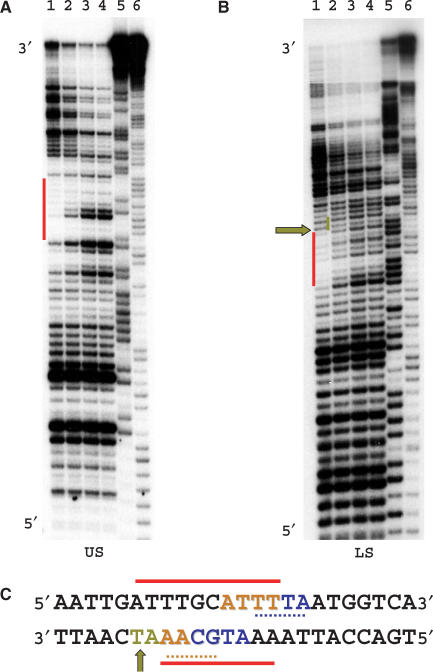
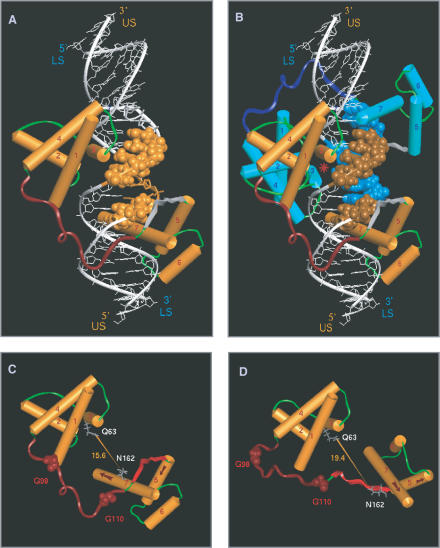
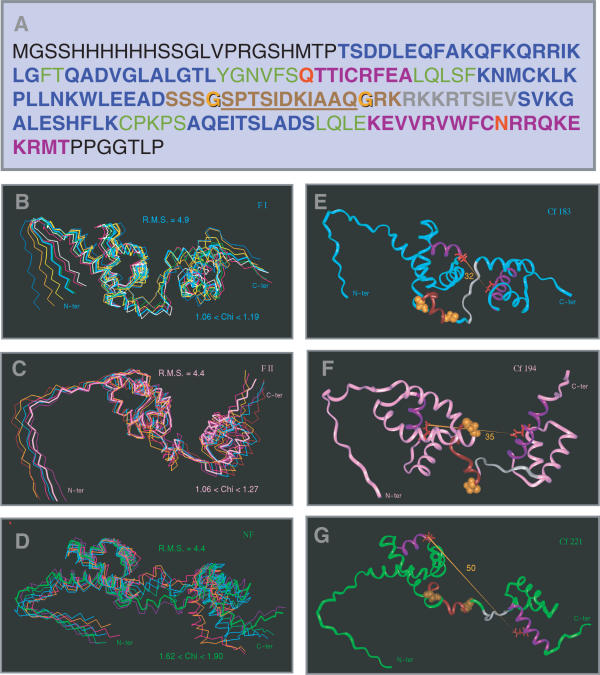
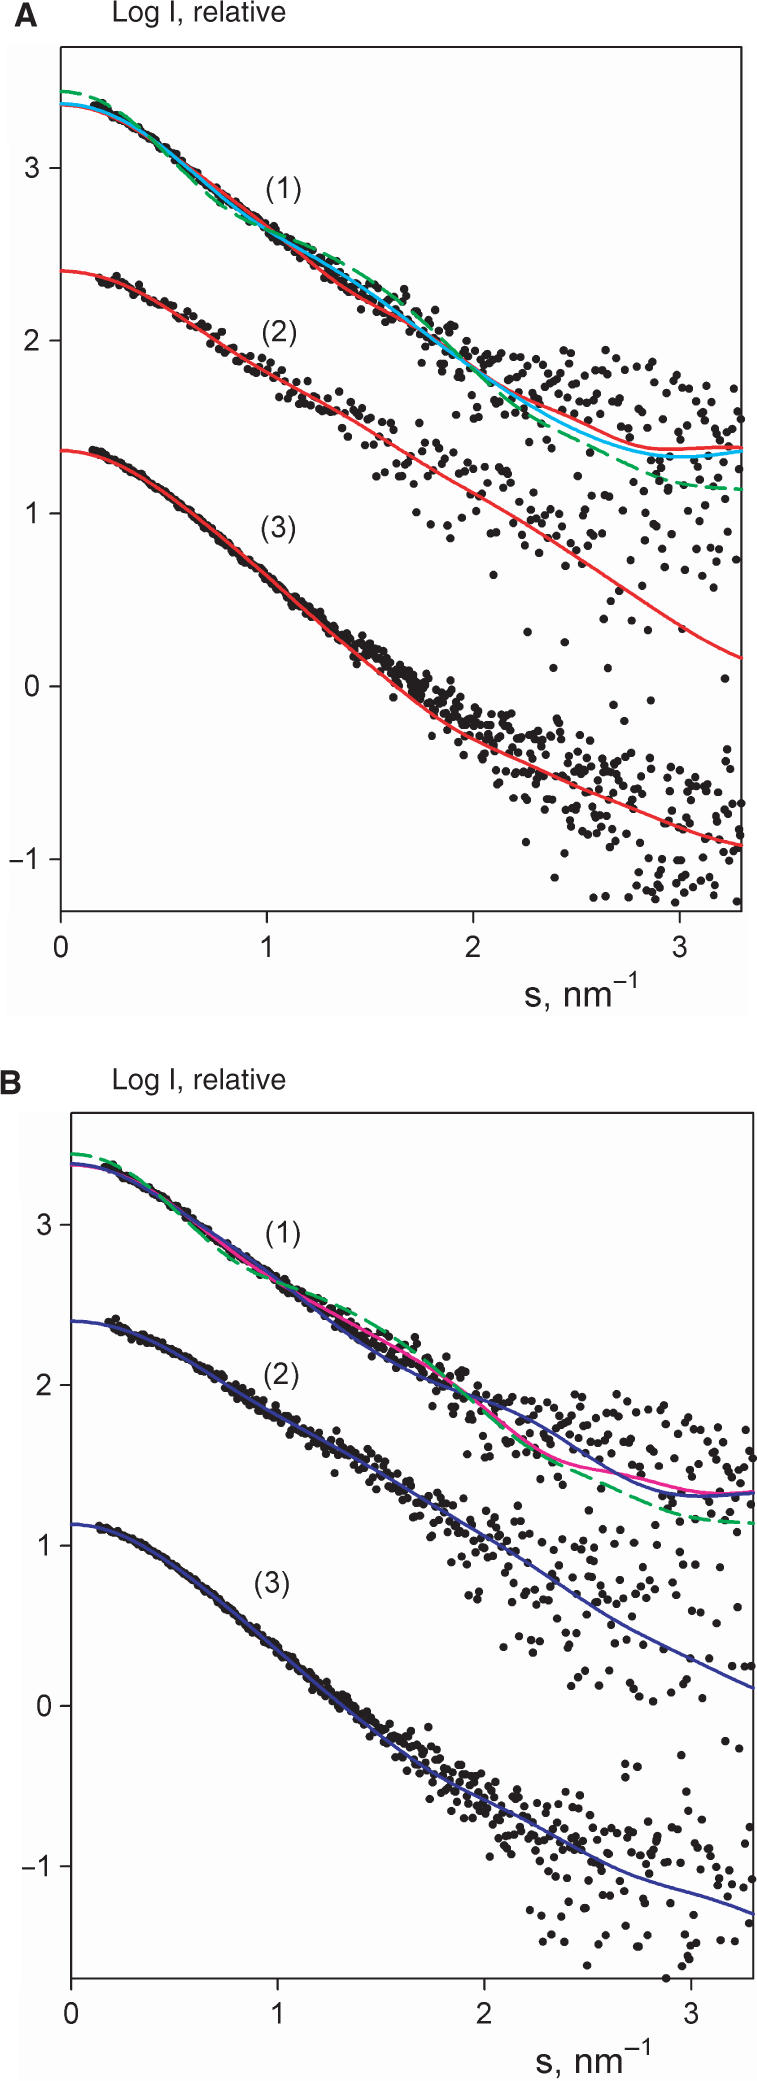
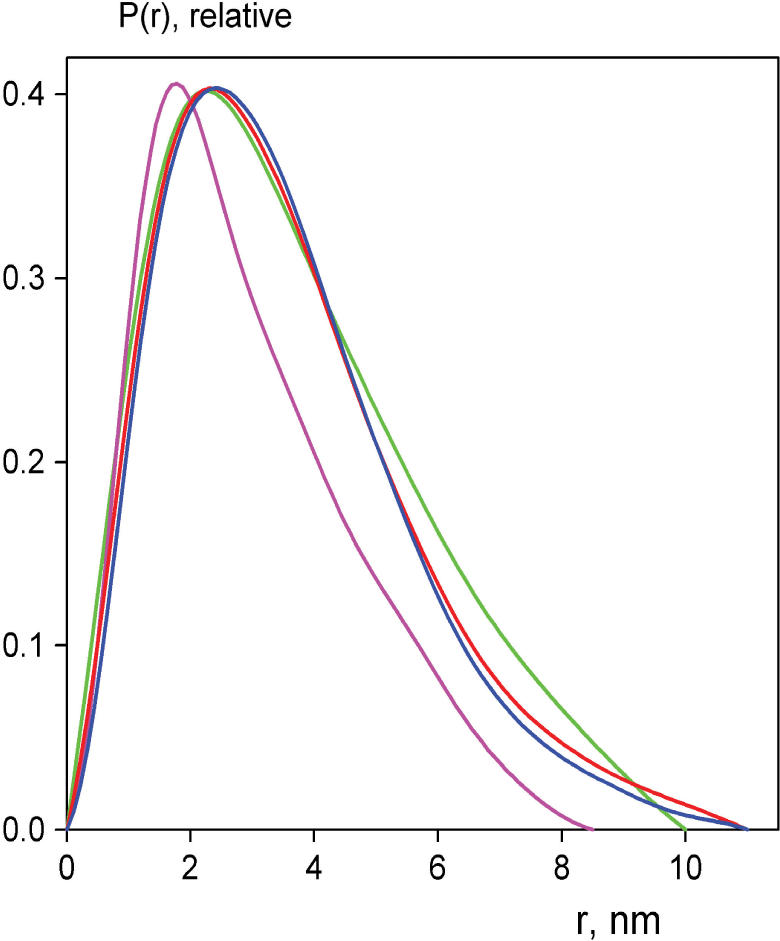
The 'POU' (acronym of Pit-1, Oct-1, Unc-86) family of transcription factors share a common DNA-binding domain of approximately 160 residues, comprising so-called 'POUs' and 'POUh' sub-domains connected by a flexible linker. The importance of POU proteins as developmental regulators and tumor-promoting agents is due to linker flexibility, which allows them to adapt to a considerable variety of DNA targets. However, because of this flexibility, it has not been possible to determine the Oct-1/Pit-1 linker structure in crystallographic POU/DNA complexes. We have previously shown that the neuronal POU protein N-Oct-3 linker contains a structured region. Here, we have used a combination of hydrodynamic methods, DNA footprinting experiments, molecular modeling and small angle X-ray scattering to (i) structurally interpret the N-Oct-3-binding site within the HLA DRalpha gene promoter and deduce from this a novel POU domain allosteric conformation and (ii) analyze the molecular mechanisms involved in conformational transitions. We conclude that there might exist a continuum running from free to 'pre-bound' N-Oct-3 POU conformations and that regulatory DNA regions likely select pre-existing conformers, in addition to molding the appropriate DBD structure. Finally, we suggest that a specific pair of glycine residues in the linker might act as a major conformational switch.


Figures

Figure 1.
Figure 1.
Characterization of the N-Oct-3 POU domain. (A) Detection of a single band with the expected N-Oct-3 DBD molecular mass by Coomassie-blue staining in 13% SDS-PAGE (see the molecular mass markers on the right). (B) Dynamic light scattering of the N-Oct-3 DBD (see text). (C) Calibration curve obtained by FPLC size-exclusion chromatography of globular proteins of known Stokes radii ‘Rs’ (see the Materials and Methods section). The arrow indicates the elution position of the N-Oct-3 POU domain.
Figure 2.
Figure 2.
Sedimentation velocity analysis of the N-Oct-3 DBD. (A) Sedimentation velocity absorbance profiles were obtained at 12°C at a rotor speed of 42 000 r.p.m. and scans were recorded at 280 nm for 21 h. The data analysis was performed using 22 regularly spaced profiles. The best-fit profiles corresponding to a single-component model are superimposed on the experimental data. For clarity, only one profile out of two is shown. (B) Corresponding residuals at a 2 mg/ml DBD concentration. (C) Continuous distributions of sedimentation coefficients obtained by considering elongated proteins of frictional ratio 1.5; protein concentration 1 mg/ml (dotted line) and 2 mg/ml (continuous line).
Figure 3.
Figure 3.
EMSA analysis of the interaction between the N-Oct-3 DBD and the DRα DNA. (A) Experiments were performed as previously described (22), except that the DNA concentration was set to 200 pM. Lane 1 corresponds to free DNA (‘D’). The protein concentration was increased by 2-fold step increments starting from 38 pM (lanes 2–15). The assay at 610 pM DBD concentration (lane 6) resulted in 50% equimolecular C1 complex formation, indicating an apparent dissociation constant Kd of 0.61 nM. Accurate calculation gave an effective Kd of 0.5 nM. (B) In these assays, radiolabeled DRα DNA was mixed with an excess of cold probe, to a final 400 nM concentration. Lane 1 corresponds to free DNA (‘D’). The protein concentration was increased by 2-fold step increments starting from 2.44 nM (lanes 2–9 and 11–15). An additional assay using the 437 nM intermediate protein concentration (lane 10) resulted in 100% equimolecular N-Oct-3 DBD/DRα DNA complex (‘C1’) formation, indicating an interaction stoichiometry of 400 nM. Note the non-cooperative mode of the N-Oct-3DBD homodimerization on the DRα DNA, as revealed by sequential 1:1 (‘C1’) and 2:1 (‘C2’) complex assembly. As the 2.560 µM protein concentration induces 100% C2 complex formation (lane 13), it must be ≥100-fold the apparent dissociation constant Kd2 for the second site (35).
Figure 4.
Figure 4.
Footprinting analysis of N-Oct-3 POU bound to the HLA DRα gene promoter. (A and B) Autoradiograms of 12% polyacrylamide denaturing gels showing the DNAse I footprints on the upper (‘US’) and lower (‘LS’) strands of the DRα promoter fragment. Lanes 1: total footprint generated by the first POU binding (red color-coding). Lanes 2: cleavage products of a mixture comprising 75% complex and 25% free DNA. Lanes 3: cleavage products of a mixture comprising 25% complex and 75% free DNA. Lanes 4: free DNA cleavage products (in the absence of protein). Lanes 5–6: Maxam-Gilbert chemical sequencing references (cleavage after purine and pyrimidine residues, respectively). (C) Assignment of the POUs and POUh tetrameric binding sites deduced from the footprints (see text). The respective display codes for the first and the second N-Oct-3 POU domains binding sites are brown and blue. The first and second POUh tetrameric sub-sites are underlined in brown and blue, respectively, to compensate for the overlap with the POUs-binding sub-sites. The green marking in (A) and (B) points to an AT motif which does not interact with the DBD. The nucleotide numbering of the upper and lower strands in the 5′-3′ direction is respectively 1–24 and 1B-24B.
Figure 5.
Figure 5.
Modeling of the N-Oct-3 POU binding to the HLA DRα gene promoter. (A and B) Predicted structures of the 1:1 (A) and 2:1 (B) complexes between the N-Oct-3 DBD and the 24 bp DRα DNA, based on the footprinting analysis. The nucleotides in contact with the first and second POU monomers are displayed in Van der Waals surface mode, using the same color-coding as in Figure 4C. The N-Oct-3 display code is: brown- or turquoise-colored cylinders for the α-helices of the first or second POU respectively, a dark-brown or dark-blue colored coil for the linker of the first or second POU, and a gray-colored ribbon for the POUh N-terminal extension. (C and D) Comparative analysis of the DRα-induced N-Oct-3 POU conformation (C) with the previously identified CRH-induced conformation (D). The two bound conformations can be interconverted by rotation around a virtual hinge Gly 98 – Gly 110 axis, taking the POUs orientation as a fixed reference. In (C) and (D), the two brown-colored arrows mark the direction of the first and third helices of POUh. The distance between the amide groups of two critical residues, Gln 63 and Asn 162, in the respective POUs and POUh DNA recognition helices (′RHdist′) is monitored in Å.
Figure 6.
Figure 6.
Conformational search by torsion driving. (A) Location of the linker (brown-coded) within the sequence of the N-Oct-3 DBD: the Gly 98 and Gly 110 residues (highlighted) flank the SPTSIDKIAAQ undecapeptide (underlined). Other critical features are the Gln 63 and Asn 162 residues (red-coded) in the respective POUs and POUh DNA recognition helices (purple-coded). Display code for the remaining elements as follows: gray for the POUh N-terminal arm, blue for helices 1, 2, 4, 5, 6, green for the regions between secondary structure elements, black for exogenous regions resulting from the DBD cloning. (B–D) Clustering of molecular mechanics-derived structures in families of potential free forms (B, C) and extended conformers (D). The conformers Cα traces are structurally aligned within a 4–5 Å R.M.S. range in each cluster. (E–G) The conformers Cf 183 (E), Cf 194 (F) and Cf 221 (G) are the best representatives of each family, respectively FI (B), FII (C) and NF (D). In all cases, Gly 98 and Gly 110 are coded in brown, Gln 63 and Asn 162 in red, the POUs and POUh recognition helices in purple. RHdist is monitored in Å.
Figure 7.
Figure 7.
Small angle X-ray scattering patterns. (A) (1) Experimental scattering pattern for the free N-Oct-3 DBD (dots), and computed scattering curves for the CRH-bound conformation (solid red line), the Cf 183 conformer (solid turquoise line) and the Cf 221 conformer (dashed green line). (2,3) Experimental (dots) and computed (color-coded) scattering patterns corresponding to the free CRH DNA (2) and the equimolecular N-Oct-3 DBD/CRH complex (3). (B) (1) Experimental scattering pattern for the free N-Oct-3 DBD (dots), and computed scattering curves for the DRα-bound conformation (solid blue line), the Cf 194 conformer (solid magenta line) and the Cf 221 conformer (dashed green line). (2,3) Experimental (dots) and computed (color-coded) scattering patterns corresponding to the free DRα DNA (2) and the equimolecular N-Oct-3 DBD/DRα complex (3). The scattering patterns have been offset in the logarithmic scale for better visualization.
Figure 8.
Figure 8.
Distance distribution functions of the free N-Oct-3 DBD (green), the free CRH DNA (magenta), the N-Oct-3/CRH (red) and the N-Oct-3/DRα (blue) complexes.

Similar articles

References

    1. Chua G, Robinson MD, Morris Q, Hughes TR. Transcriptional networks: reverse-engineering gene regulation on a global scale. Curr. Opin. Microbiol. 2004;7:638–646. - PubMed
    1. Lardenois A, Chalmel F, Bianchetti L, Sahel JA, Leveillard T, Poch O. PromAn: an integrated knowledge-based web server dedicated to promoter analysis. Nucleic Acids Res. 2006;34:W578–583. - PMC - PubMed
    1. Sinha S, Liang Y, Siggia E. Stubb: a program for discovery and analysis of cis-regulatory modules. Nucleic Acids Res. 2006;34:W555–W559. - PMC - PubMed
    1. Gunewardena S, Zhang Z. Accounting for structural properties and nucleotide co-variations in the quantitative prediction of binding affinities of protein-DNA interactions. Pac. Symp. Biocomput. 2006:379–390. - PubMed
    1. Garvie CW, Wolberger C. Recognition of specific DNA sequences. Mol. Cell. 2001;8:937–946. - PubMed

Publication types