. 2007;35(12):4214-22.
doi: 10.1093/nar/gkm316. Epub 2007 Jun 18.

Intramolecular DNA quadruplexes with different arrangements of short and long loops

Affiliations

Intramolecular DNA quadruplexes with different arrangements of short and long loops

Phillip A Rachwal et al. Nucleic Acids Res. 2007.

Abstract

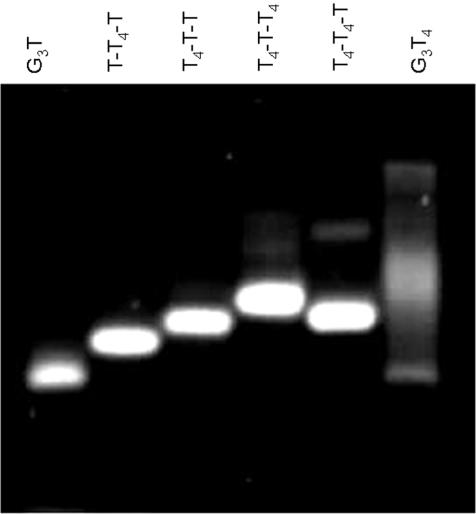
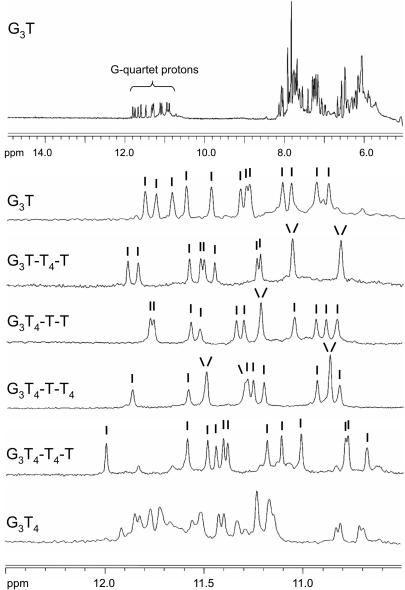
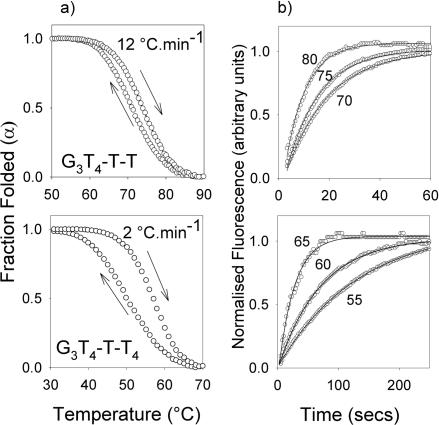
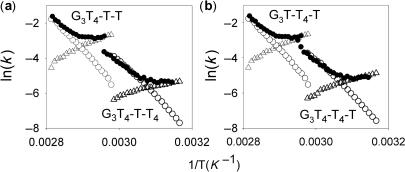
We have examined the folding, stability and kinetics of intramolecular quadruplexes formed by DNA sequences containing four G3 tracts separated by either single T or T4 loops. All these sequences fold to form intramolecular quadruplexes and 1D-NMR spectra suggest that they each adopt unique structures (with the exception of the sequence with all three loops containing T4, which is polymorphic). The stability increases with the number of single T loops, though the arrangement of different length loops has little effect. In the presence of potassium ions, the oligonucleotides that contain at least one single T loop exhibit similar CD spectra, which are indicative of a parallel topology. In contrast, when all three loops are substituted with T4 the CD spectrum is typical of an antiparallel arrangement. In the presence of sodium ions, the sequences with two and three single T loops also adopt a parallel folded structure. Kinetic studies on the complexes with one or two T4 loops in the presence of potassium ions reveal that sequences with longer loops display slower folding rates.


Figures

Figure 1.
Figure 1.
CD spectra of the fluorescently-labelled quadruplex-forming oligonucleotides in the presence of 10 mM lithium phosphate pH 7.4 containing 200 mM KCl (a) or 200 mM NaCl (b). G3T, black; G3T-T4-T, red; G3T4-T-T, blue; G3T4-T-T4, pink; G3T4-T4-T, green; G3T4, cyan. The inset to the upper panel shows the CD spectrum of G3T4 in the presence of different concentrations of KCl: black 1 mM; red, 5 mM; green 20 mM; blue 50 mM; pink, 200 mM.
Figure 2.
Figure 2.
Mobility of the quadruplex-forming oligonucleotides on a 14% polyacrylamide gel supplemented with 20 mM KCl.
Figure 3.
Figure 3.
1D imino proton NMR spectra of the quadruplex-forming oligonucleotides. The samples (100 µM) were prepared in 200 mM potassium phosphate pH 7.4. The top panel shows the 1D-NMR spectrum for G3T between 5 and 15 p.p.m., while the other panels show the imino proton region for each oliogonucleotide. The individual peaks are indicated.
Figure 4.
Figure 4.
Fluorescence melting profiles for the quadruplex-forming oligonucleotides. The reactions were performed in 10 mM lithium phosphate pH 7.4 containing either 20 mM KCl (left hand panel) or 200 mM NaCl (right hand panel). The temperature was changed at 0.2°C.min−1. The curves show the fraction folded (α) as a function of temperature, calculated as described in the Methods section. G3T, black; G3T-T4-T, red; G3T4-T-T, blue; G3T4-T-T4, pink; G3T4-T4-T, green; G3T4, cyan.
Figure 5.
Figure 5.
(a) Hystersis between the melting and annealing profiles for G3T4-T-T (upper panel, with a temperature change of 12°C.min−1) and G3T4-T-T4 (lower panel, with a temperature change of 2°C.min−1 in the presence of 10 mM lithium phosphate pH 7.4 containing 20 mM KCl. (b) temperature-jump relaxation profiles for G3T4-T-T (upper panel) and G3T4-T-T4 (lower panel. The traces show the rate of approach to a new equilibrium following a rapid 5°C increase in temperature to the value shown. The profiles have been normalized to show the fractional change in fluorescence with time.
Figure 6.
Figure 6.
Arrhenius plots showing the temperature dependence of the kinetic parameters for G3T4-T-T and G3T4-T-T4 (a) and G3T-T4-T and G3T4-T4-T (b). Open symbols were derived from the hysteresis between the melting and annealing profiles; k−1, open circles; k1, open triangles. Filled circles show the time constants obtained from the temperature-jump experiments (k1 + k−1).

References

    1. Burge S, Parkinson GN, Hazel P, Todd AK, Neidle S. Quadruplex DNA: sequence, topology and structure. Nucleic Acids Res. 2006;34:5402–5415. - PMC - PubMed
    1. Davis JT. G-quartets 40 years later: From 5′-GMP to molecular biology and supramolecular chemistry. Angew. Chem. Int. Ed. Engl. 2004;43:668–698. - PubMed
    1. Phan AT, Kuryavyi V, Patel DJ. DNA architecture: from G to Z. Curr. Opin. Struct. Biol. 2006;16:288–298. - PMC - PubMed
    1. Simonsson T. G-quadruplex DNA structures - Variations on a theme. Biol. Chem. 2001;382:621–628. - PubMed
    1. Sen D, Gilbert W. A sodium-potassium switch in the formation of 4-stranded G4-DNA. Nature. 1990;344:410–414. - PubMed

Publication types