. 2007 Jun 18;177(6):995-1004.
doi: 10.1083/jcb.200611113.

Quantitative analysis of an anaphase B switch: predicted role for a microtubule catastrophe gradient

Affiliations

Quantitative analysis of an anaphase B switch: predicted role for a microtubule catastrophe gradient

Dhanya K Cheerambathur et al. J Cell Biol. .

Abstract

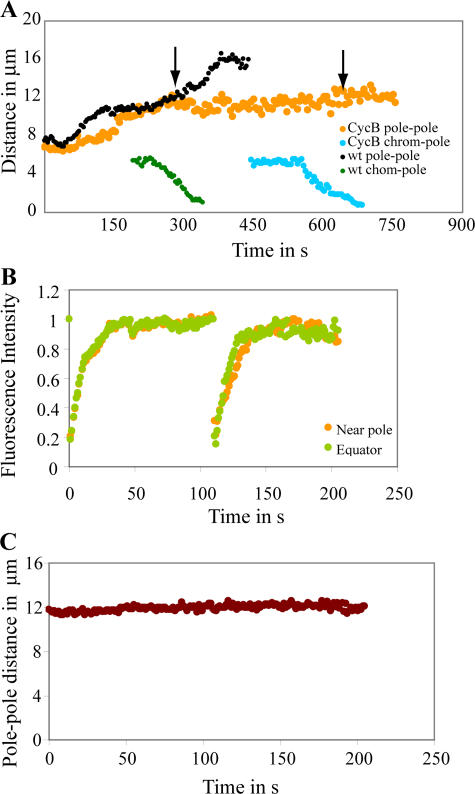
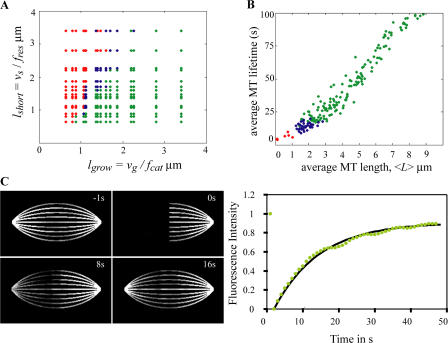
Anaphase B in Drosophila embryos is initiated by the inhibition of microtubule (MT) depolymerization at spindle poles, which allows outwardly sliding interpolar (ip) MTs to drive pole-pole separation. Using fluorescence recovery after photobleaching, we observed that MTs throughout the preanaphase B spindle are very dynamic and display complete recovery of fluorescence, but during anaphase B, MTs proximal to the poles stabilize and therefore display lower recovery than those elsewhere. Fluorescence microscopy of the MT tip tracker EB1 revealed that growing MT plus ends localize throughout the preanaphase B spindle but concentrate in the overlap region of interpolar MTs (ipMTs) at anaphase B onset. None of these changes occurred in the presence of nondegradable cyclin B. Modeling suggests that they depend on the establishment of a spatial gradient of MT plus-end catastrophe frequencies, decreasing toward the equator. The resulting redistribution of ipMT plus ends to the overlap zone, together with the suppression of minus-end depolymerization at the poles, could constitute a mechanical switch that initiates spindle elongation.


Figures

Figure 1.
Figure 1.
MTs turn over rapidly in a preanaphase B spindle, and the fluorescence recovery is uniform within a bleached region. The micrograph shows a spindle in preanaphase B, bleached in a 5-μm-wide region extending from the centrosome to the equator (half-spindle). The 5-μm bleached region was divided into 1-μm subsegments to analyze the recovery kinetics along the length of the spindle axis. The plots on the right are the recovery curves of the half-spindle and individual 1-μm subsegments, and the table below shows their half-time and percentage of recovery. Note that there is no notable difference in half-time or percentage of recovery of the half-spindle and the 1-μm subsegments. See also Video 1 (available at http://www.jcb.org/cgi/content/full/jcb.200611113/DC1). Bar, 5 μm.
Figure 2.
Figure 2.
Anaphase B spindles exhibit a spatial difference in MT turnover compared with preanaphase B spindles. (A) Micrographs of a preanaphase B spindle bleached simultaneously at two separate regions. See also Video 2 (available at http://www.jcb.org/cgi/content/full/jcb.200611113/DC1). (B) Normalized fluorescence recovery curves of the two bleach zones and exponential fits (black lines). During preanaphase B, both regions recover to the same extent, ∼85% with t1/2 of 8 and 5 s at the pole and equator, respectively. In the bottom panel, constant pole–pole distance shows that the spindle is in preanaphase B steady state. (C) Micrographs of an anaphase B spindle bleached simultaneously near the pole and equator. See also Video 3. (D) The normalized fluorescence recovery curves of the two bleach zones with their corresponding exponential fits (black lines). The bleached zone closer to the pole recovers to a strikingly lower extent, ∼40% compared with that in the spindle equator, ∼90%, and t1/2 is 3 and 5 s at the pole and equator, respectively. The bottom panel shows an increasing pole–pole distance, indicating that the spindle is in anaphase B. The insets in the graphs in B and D show higher resolution plots of pole–pole distance versus time. Bars, 5 μm.
Figure 3.
Figure 3.
MT plus ends redistribute at anaphase B onset. (A and B) Localization of the plus-end tip tracker EB1 tagged to GFP (green in merged) during preanaphase B (A) and anaphase B (B) in a transgenic embryo injected with rhodamine tubulin (red in merged). Note that there is a redistribution of EB1-GFP at anaphase B. The images are frames of the time-lapse video of one spindle. Bars, 5 μm. (C) EB1-GFP localization on a spindle in an embryo injected with stable GST–cyclin B. Bar, 5 μm. (D and E) Total fluorescence intensity across a spindle expressing EB1-GFP as a function of time during preanaphase B and anaphase B. (D) In the wild type, at anaphase B onset (white arrowhead), there is an abrupt decrease in EB1 levels near the poles, whereas there is no change in fluorescence intensity at the equator. See also Video 4 (available at http://www.jcb.org/cgi/content/full/jcb.200611113/DC1). (E) No redistribution of EB1-GFP occurs in the embryo injected with stable GST–cyclin B, even though the spindle is imaged for a longer time; the pink arrowhead represents the time point at which anaphase B would have happened in a normal cell cycle. The kymographs were made by averaging the total intensity per pixel along the spindle width. Red shows brightest intensity, whereas dark blue indicates lowest intensity. (F) Pole–pole distance of the spindles shown in D and E. The arrows indicate the beginning of metaphase steady state, the time point at which the kymographs begin in D and E.
Figure 4.
Figure 4.
MT turnover and anaphase A after injection of stable GST–cyclin B. (A) Pole–pole and chromosome-to-pole distances in a wild-type (wt) and a stable GST–cyclin B–injected embryo expressing GFP-histone and injected with rhodamine tubulin. In wild type, anaphase B spindle elongation occurs after anaphase A (see arrow), whereas in the spindle with stable GST–cyclin B, no anaphase B occurs (see arrow), even though it undergoes anaphase A, albeit much later and at a slower rate. (B) Fluorescence recovery curves from a FRAP experiment where a spindle in a stable GST–cyclin B–injected embryo was sequentially double bleached near the pole and equator. Both the pole and equatorial regions recover to the same extent during the successive bleaches (∼94% with t1/2 of 7.7 and 8 s, and ∼96% with t1/2 of 6 and 9 s, respectively). Note that the second double bleach was done >100 s after the first one, a time scale within which the anaphase B transition happens in a wild-type spindle. (C) Pole–pole distance for the spindle shown in B.
Figure 5.
Figure 5.
High MT dynamic parameters explain rapid MT turnover in Drosophila embryonic spindles. (A and B) Half-times from in silico FRAP of half spindles computed for 256 spindles with varying MT dynamics. The values of MT dynamic parameters used were between 0.1 and 0.3 μm/s for vg and vs and 0.05 and 0.25 s−1 for fcat and fres, in steps of 0.06 μm/s for the velocities and 0.05 s−1 for the frequencies. (A) FRAP half-times (colored dots) in terms of the mean growth (lgrow) and shrinkage lengths (lshort). (B) Same data plotted in terms of the mean length of the MTs, <L>, and the mean cycle duration (1/fres + 1/fcat). Red dots show combinations of MT dynamics where the antiparallel overlap could not be maintained and vanished completely during preanaphase B; blue dots indicate combinations that gave rise to FRAP half-times <10 s during preanaphase B (rapid and in agreement with our experimental observations); and green dots indicate combinations of parameters that led to FRAP half-times >10 s (see the supplemental text, available at http://www.jcb.org/cgi/content/full/jcb.200611113/DC1). (C, left) Snapshots from a typical in silico FRAP of a half-spindle in preanaphase B. See also Video 5. (right) The recovery curve (green dots) and the corresponding exponential fit (black line). vg = vs = 0.34 μm/s, fres = 0.2 s−1, and fcat = 0.25s−1.
Figure 6.
Figure 6.
A catastrophe gradient within the spindle at anaphase B onset explains the observed spatial changes in MT dynamics and growing plus-end distribution. (A) Snapshots from in silico FRAP of the pole region of an anaphase B spindle (recovery plot shown in B). See also Video 7 (available at http://www.jcb.org/cgi/content/full/jcb.200611113/DC1). The behavior of individual MTs in a single ipMT bundle (30 MTs emanating from opposing poles) is shown. MTs with minus ends anchored to the left and the right pole are shown in green and yellow, respectively. The bleached portions of the MTs after the bleach (0 s) are shown in red. (B) The plot is the normalized fluorescence recovery curves of two in silico bleach zones of an anaphase B spindle with the corresponding exponential fits (black lines); t1/2 = 5.6 s at the equator and t1/2 = 2.8 s at the pole. (C) In silico kymograph of the positions of the growing plus ends of MTs over time in a spindle where a catastrophe gradient (with fcat = 0.15 s−1 at the equator and three times higher value at the poles; see Fig. S3 C) is introduced at anaphase B onset (t = 100 s). The horizontal axis indicates the distance away from the spindle equator. The warmer colors indicate high concentration of growing plus end.
Figure 7.
Figure 7.
Cartoon showing the reorganization of the plus ends of MTs during preanaphase B and anaphase B. During preanaphase B, there is a uniform distribution of growing MT plus ends as indicated by the presence of EB1 (orange MT tips), whereas MT (green lines) plus ends undergo dynamic instability (green curved arrows). Spindle length is maintained by poleward flux involving ipMT minus-end depolymerization at the poles (light green curved arrows) coupled to outward sliding by the bipolar kinesin-5, KLP61F (solid black arrows). At anaphase B onset, a catastrophe gradient abruptly evolves, leading to a swift change in the MT lengths and thereby rapidly relocalizing the growing ipMT plus ends to the spindle midzone. The sustained presence of growing ipMT plus ends at the equator during anaphase B serves to maintain robust antiparallel ipMT bundles on which KLP61F generates the forces that push the poles apart. (bottom) A simplified version of our model for anaphase B (Brust-Mascher et al., 2004) where, in preanaphase B spindles, depolymerization by KLP10A at the poles balances the sliding of ipMTs by KLP61F, but depolymerization at the poles ceases at anaphase B onset, allowing persistent ipMT sliding to drive pole–pole separation.

References

    1. Ashburner, M. 1989. Drosophila: A Laboratory Handbook. Cold Spring Harbor Laboratory Press. Cold Spring Harbor, NY. 1331 pp.
    1. Brinkley, B.R., and J. Cartwright Jr. 1971. Ultrastructural analysis of mitotic spindle elongation in mammalian cells in vitro: direct microtubule counts. J. Cell Biol. 50:416–431. - PMC - PubMed
    1. Brust-Mascher, I., and J.M. Scholey. 2002. Microtubule flux and sliding in mitotic spindles of Drosophila embryos. Mol. Biol. Cell. 13:3967–3975. - PMC - PubMed
    1. Brust-Mascher, I., G. Civelekoglu-Scholey, M. Kwon, A. Mogilner, and J.M. Scholey. 2004. Model for anaphase B: role of three mitotic motors in a switch from poleward flux to spindle elongation. Proc. Natl. Acad. Sci. USA. 101:15938–15943. - PMC - PubMed
    1. Burbank, K.S., A.C. Groen, Z.E. Perlman, D.S. Fisher, and T.J. Mitchison. 2006. A new method reveals microtubule minus ends throughout the meiotic spindle. J. Cell Biol. 175:369–375. - PMC - PubMed

Publication types