. 2007 Jun 18;177(6):1119-32.
doi: 10.1083/jcb.200701040.

p75 neurotrophin receptor regulates tissue fibrosis through inhibition of plasminogen activation via a PDE4/cAMP/PKA pathway

Affiliations

p75 neurotrophin receptor regulates tissue fibrosis through inhibition of plasminogen activation via a PDE4/cAMP/PKA pathway

Benjamin D Sachs et al. J Cell Biol. .

Abstract

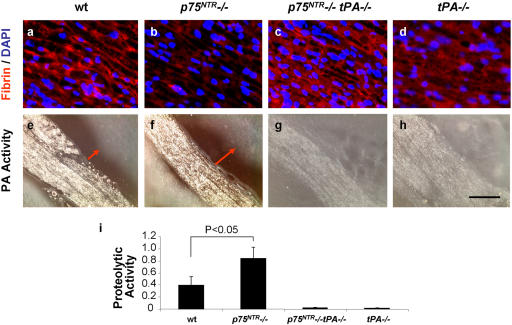
Clearance of fibrin through proteolytic degradation is a critical step of matrix remodeling that contributes to tissue repair in a variety of pathological conditions, such as stroke, atherosclerosis, and pulmonary disease. However, the molecular mechanisms that regulate fibrin deposition are not known. Here, we report that the p75 neurotrophin receptor (p75(NTR)), a TNF receptor superfamily member up-regulated after tissue injury, blocks fibrinolysis by down-regulating the serine protease, tissue plasminogen activator (tPA), and up-regulating plasminogen activator inhibitor-1 (PAI-1). We have discovered a new mechanism in which phosphodiesterase PDE4A4/5 interacts with p75(NTR) to enhance cAMP degradation. The p75(NTR)-dependent down-regulation of cAMP results in a decrease in extracellular proteolytic activity. This mechanism is supported in vivo in p75(NTR)-deficient mice, which show increased proteolysis after sciatic nerve injury and lung fibrosis. Our results reveal a novel pathogenic mechanism by which p75(NTR) regulates degradation of cAMP and perpetuates scar formation after injury.


Figures

Figure 1.
Figure 1.
Fibrin deposition is reduced in the sciatic nerve of p75NTR/ mice. Immunohistochemistry for fibrin on uninjured wt (a) and 4 d after sciatic nerve crush injury wt (c) and p75 NTR/ mice (e). Immunohistochemistry for p75NTR on uninjured wt (b) and 4 d after sciatic nerve crush injury wt (d) and p75 NTR/ mice (f). Representative images are shown from n = 20 wt and n = 20 p75 NTR/ mice. (g) Western blot for p75NTR and fibrin on sciatic nerve extracts from uninjured wt, and wt and p75 NTR/ mice 3 and 8 d after injury. Myosin serves as loading control. Western blots were performed three times. A representative blot is shown. (h) Quantification of fibrin deposition shows significant decrease for fibrin in p75 NTR/ mice (n = 5), when compared with wt mice (n = 4). Bar graph represents means ± SEM (P < 0.003; by t test). Bar, 25 μm.
Figure 2.
Figure 2.
p75NTR regulates expression of tPA in the sciatic nerve after crush injury. In situ zymography in the presence of plasminogen on wt (a) and p75 NTR/ (b) mice and in the absence of plasminogen (c) or in the presence of plasminogen and tPASTOP (d) in p75 NTR−/− mice. Arrows indicate the lytic zone. Double immunofluorescence for tPA (green) or p75NTR (red) on wt (e and h), p75 NTR−/− (f) and p75 NTR−/− tPA / mice (g). Uninjured wt sciatic nerve exhibits minimal proteolytic activity (i) and minimal tPA and p75NTR immunoreactivity (j). Zymographies have been performed on n = 10 wt and n = 10 p75 NTR/ mice. Representative images are shown. tPA (k) and p75NTR (l) expression in SCs was verified by double immunofluorescence with an S100 (SC marker) antibody. Arrows indicate double-positive cells (k and l, yellow). The experiment was repeated at two different time points (4 and 8 d after crush injury) in n = 4 mice per genotype per time point and representative images are shown. Bar: 400 μm (a–d, i), 150 μm (e–g, j), 20 μm (h, k, and l).
Figure 3.
Figure 3.
Loss of tPA rescues the effects of p75NTR deficiency in plasminogen activation and fibrin deposition in the sciatic nerve. Increased fibrin deposition in the crushed sciatic nerve of p75 NTR−/− tPA −/− mice (c), when compared with crushed p75 NTR−/− sciatic nerve (b). Wt (a) and tPA −/− (d) nerves are used for control. In situ zymography shows lack of proteolytic activity in the crushed p75 NTR−/− tPA −/− sciatic nerves (n = 5) (g), when compared with crushed p75 NTR−/− sciatic nerves (n = 20) (f). Crushed wt (e) and tPA −/− (h) nerves are used for control. Fibrin immunostainings and zymographies were performed on n = 5 p75 NTR−/− tPA −/−, n = 20 p75 NTR−/−, n = 20 wt, n = 5 tPA −/− mice. Representative images are shown. (i) Quantification of proteolytic activity 4 d after crush injury shows statistically significant increase for proteolytic activity in p75 NTR/ mice. Quantification results are based on n = 5 p75 NTR/, n = 5 p75 NTR−/− tPA −/−, n = 5 tPA −/− and n = 4 wt mice. Bar graph represents means ± SEM (*, P < 0.05; by ANOVA). Bar: 50 μm (a–d), 300 μm (e–h).
Figure 4.
Figure 4.
p75NTR-mediated regulation of tPA and fibrinolysis in SCs. Primary SC cultures from wt (a) or p75 NTR/ mice (b) on a 3D fibrin gel. Arrowheads indicate the border of fibrin degradation. Quantification of fibrin degradation (c) and tPA activity (d) from wt and p75 NTR/ SCs. Experiments were performed three times in duplicates. Representative images are shown. Bar graph represents means ± SEM (P < 0.01; by t test). Bar, 130 μm.
Figure 5.
Figure 5.
Expression of p75NTR regulates tPA, PAI-1, and fibrinolysis in fibroblasts. 3D fibrin gel degraded by NIH3T3 (a), but not by NIH3T3p75NTR cells (b). (c) Quantification of fibrin degradation. Experiments were performed seven times in duplicates. Phase-contrast microscopy shows lytic zones in NIH3T3 (d), but not in NIH3T3p75NTR cultures (e). Zymography shows degradation of casein by NIH3T3 cells (f), whereas NIH3T3p75NTR cells do not degrade casein (g). Quantification of tPA (h) and uPA (i) activity in supernatants from NIH3T3 and NIH3T3p75NTR cultures. Experiments were performed five times in duplicates. (j) RT-PCR analysis for tPA, PAI-1, uPA, and GAPDH on cDNA derived from NIH3T3 and NIH3T3p75NTR cells. (k) RT-PCR analysis for tPA and GAPDH on cDNA derived from uninjured wt, and wt or p75 NTR/ mice three days after nerve injury. Bar graphs represent means ± SEM (statistics by t test). Bar: 1.2 cm (a and b), 130 μm (d–g).
Figure 6.
Figure 6.
p75NTR regulates tPA and PAI-1 via a PDE4/cAMP/PKA pathway. (a) db-cAMP induces fibrinolysis in NIH3T3p75NTR cells. (b) IBMX increases tPA activity of NIH3T3p75NTR cells to the levels of NIH3T3 cells. Inhibition of PKA by KT5720 shows decrease of tPA activity in both NIH3T3 and NIH3T3p75NTR cells (P < 0.0001). (c) PKA activity assay shows decrease of PKA in NIH3T3p75NTR cells. (d) Forskolin increases tPA mRNA in NIH3T3 and NIH3T3p75NTR cells. Inhibition of PKA by KT5720 decreases tPA transcript. (e) Quantification of PAI-1 mRNA changes by real time PCR shows a fourfold increase of PAI-1 mRNA in NIH3T3p75NTR cells compared with NIH3T3 cells. (f) Forskolin increases tPA activity in both wt (P<0.001) and p75 NTR−/− (P < 0.00001) SCs. NGF and BDNF do not affect activity of tPA (P > 0.8 and P > 0.3, respectively). (g) Transient overexpression of FL p75NTR or p75 ICD leads to decreased levels of tPA in NIH3T3 cells. Experiments were performed at least 5 times in duplicates. *, P < 0.0001; **, P < 0.05; ***, P < 0.01. NS: non-significant. Bar graphs represent means ± SEM (statistics by ANOVA).
Figure 7.
Figure 7.
p75NTR decreases intracellular cAMP via PDE4. (a) cAMP levels in NIH3T3 and NIH3T3p75NTR cells show a reduction of cAMP in NIH3T3p75NTR cells, as compared with NIH3T3 cells. Treatment with PTX, IBMX, specific inhibitors for PDE1, PDE2, PDE3, and PDE4 (rolipram) shows that only IBMX (IC50 for PDE4 2–50 μM) and rolipram (IC50 for PDE4 0.8 μM) (P < 0.0001) increase levels of cAMP in NIH3T3p75NTR cells to the levels of NIH3T3 cells. (b) Transient overexpression of FL p75NTR or p75 ICD leads to decreased levels of cAMP in NIH3T3 cells. (c) siRNA mediated knockdown of p75NTR levels in NIH3T3p75NTR cells leads to increased levels of cAMP. (d) siRNA mediated knockdown of p75NTR in primary rat Schwann cells leads to increased levels of cAMP. p75NTR levels after siRNA knock down in duplicate samples of NIH3T3p75NTR cells (e) and SCs (f). Immunostaining to detect cAMP in injured sciatic nerve reveals increased cAMP immunoreactivity in the sciatic nerve of p75 NTR/ mice (h) when compared with wt controls (g). Experiments were performed four times in duplicate. Bar graphs represent means ± SEM (statistics by ANOVA or t test).
Figure 8.
Figure 8.
p75NTR interacts with PDE4A4/5. (a) Endogenous PDE4A5 co-IPs with p75NTR in NIH3T3p75NTR cells. Lysates were immunoprecipitated with anti-p75NTR and probed with anti-PDE4A or anti-p75NTR. Due to the low endogenous levels of PDE4A, higher exposure was necessary to detect PDE4A5 in the lysates (see Fig. S3 c). (b) FRET emission ratio change of NIH3T3 and NIH3T3p75NTR cells for the pm-AKAR2.2 in response to forskolin. FRET change represents membrane activation of PKA (c) Mapping of the p75NTR sites required for interaction with PDE4A5. Schematic diagram of HA-tagged p75NTR intracellular deletions. TM, transmembrane domain; DD, death domain. Lysates were immunoprecipitated with an anti-HA antibody and probed with anti-PDE4A or anti-p75NTR. (d) Mapping of the PDE4A4 sites required for interaction with p75NTR. Schematic diagram of the C-terminal deletion of PDE4A4. Arrow indicates the deletion site. Lysates were immunoprecipitated with anti-p75NTR and probed with anti-PDE4A or anti-p75NTR. (e) Co-IP of purified, recombinant proteins reveals that both PDE4A4 and PDE4A5 interact with the ICD of p75NTR, but PDE4D3 does not. (f) PDE4A4 peptide library screened with recombinant GST-p75NTR ICD revealed three distinct domains of PDE4A4 (asterisks in d) that interact with the ICD of p75NTR: the LR1 domain (peptides 40 and 41), the catalytic domain (peptides 135 and 136) and the unique C terminus (peptides 172 and 173). (g) Alanine scanning mutagenesis shows that substitution of C862 abolishes the interaction of p75NTR with the 173 peptide that is unique to PDE4A.
Figure 9.
Figure 9.
p75NTR regulates fibrin clearance in the lung. LPS induces fibrin deposition (red) in the wt lung (b), when compared with the saline-injected lung (a). Lungs derived from p75 NTR/ mice show less fibrin deposition (c). In situ zymography after 3 h of incubation shows clearance of casein in the lung of saline-injected wt (d), when compared with LPS injected wt lung (e). Lung from LPS-treated p75 NTR/ mouse shows enhanced proteolytic activity (f), when compared with the wt mouse (e). Immunoreactivity for PAI-1 is increased in wt lung derived from LPS-treated mouse (h), when compared with saline-treated control (g). Lung from LPS-treated p75 NTR/ mouse shows decreased PAI-1 (i), when compared with the wt LPS-treated mouse (h). (j) Western blot of fibrin precipitation from the lung shows an up-regulation of fibrin in the LPS-treated wt lung, when compared with the p75 NTR/ lung. (k) Western blot for PAI-1 in the lung shows a decrease of PAI-1 in the p75 NTR/ lung, when compared with the wt lung. Images are representative of n = 10 wt and n = 9 p75 NTR/ mice. Western blots have been performed for n = 4 wt and n = 4 p75 NTR/ mice. Bar: 150 μm (a–c), 75 μm (a–c, inset), 200 μm (d–f), 150 μm (g–i).
Figure 10.
Figure 10.
Proposed model for the role of p75NTR in the cAMP-mediated plasminogen activation. p75NTR interacts with PDE4A4/5 resulting in degradation of cAMP and thus a reduction of PKA activity. Decrease in cAMP reduces expression of tPA and increases PAI-1, resulting in reduction of plasmin and plasmin-dependent extracellular proteolysis. Reduction of plasmin results in reduced fibrin degradation and ECM remodeling. Because plasmin can proteolytically modify nonfibrin substrates, such as growth factors and cytokines, this mechanism may be upstream of various cellular functions.

Similar articles

Cited by

References

    1. Adams, R.A., M. Passino, B.D. Sachs, T. Nuriel, and K. Akassoglou. 2004. Fibrin mechanisms and functions in nervous system pathology. Mol. Interv. 4:163–176. - PubMed
    1. Akassoglou, K., K.W. Kombrinck, J.L. Degen, and S. Strickland. 2000. Tissue plasminogen activator-mediated fibrinolysis protects against axonal degeneration and demyelination after sciatic nerve injury. J. Cell Biol. 149:1157–1166. - PMC - PubMed
    1. Akassoglou, K., W.-M. Yu, P. Akpinar, and S. Strickland. 2002. Fibrin inhibits peripheral nerve regeneration by arresting Schwann cell differentiation. Neuron. 33:861–875. - PubMed
    1. Allen, M.D., and J. Zhang. 2006. Subcellular dynamics of protein kinase A activity visualized by FRET-based reporters. Biochem. Biophys. Res. Commun. 348:716–721. - PubMed
    1. Barber, R., G.S. Baillie, R. Bergmann, M.C. Shepherd, R. Sepper, M.D. Houslay, and G.V. Heeke. 2004. Differential expression of PDE4 cAMP phosphodiesterase isoforms in inflammatory cells of smokers with COPD, smokers without COPD, and nonsmokers. Am. J. Physiol. Lung Cell. Mol. Physiol. 287:L332–L343. - PubMed

Publication types

MeSH terms

Substances