. 2007 Sep;51(9):3264-72.
doi: 10.1128/AAC.00036-07. Epub 2007 Jun 18.

Association of saquinavir plasma concentrations with side effects but not with antiretroviral outcome in patients infected with protease inhibitor-susceptible human immunodeficiency virus type 1

Affiliations

Association of saquinavir plasma concentrations with side effects but not with antiretroviral outcome in patients infected with protease inhibitor-susceptible human immunodeficiency virus type 1

Jörn Lötsch et al. Antimicrob Agents Chemother. 2007 Sep.

Abstract

The objective of this study was to identify parameters among saquinavir pharmacokinetics, patients' demographics or comedications, to be addressed for improved personalized therapy. The presence of human immunodeficiency virus type 1 (HIV-1) RNA at therapy week 48 (principal target parameter), CD4 cell count at week 48, infections and side effects during 48 weeks, indicators of liver toxicity and lipid abnormalities at week 48, and a 12-h saquinavir plasma concentration-versus-time profile were assessed in 56 patients receiving saquinavir-ritonavir (1,000 and 100 mg, respectively) twice daily (44 therapy-naïve and 12 antiretrovirally pretreated patients) for association with saquinavir plasma concentrations, demographics, baseline values of target parameters, and coadministered antiretrovirals. Antiretroviral failure was observed in 8 of the 56 patients in whom HIV-1 RNA was detectable at week 48. This therapeutic failure was not associated with individual saquinavir pharmacokinetics. More likely, therapeutic failure was related to incidences interfering with antiretroviral therapy, causing therapy interruptions or incompliance. Weak associations were, however, seen between high maximum saquinavir plasma concentrations and both CD4 counts of > or =200 cells microl(-1) at week 48 (P = 0.014) and constitutional side effects during 48 weeks (P = 0.002). However, patients with high CD4 counts and constitutional side effects were not identical (P = 0.53). Saquinavir therapeutic drug monitoring in patients infected with protease inhibitor-susceptible HIV-1 taking saquinavir-ritonavir (1,000 and 100 mg, respectively) is not demanded for improving the antiretroviral effect. It may be contemplated in cases with constitutional side effects or low CD4 counts with weak immune responses.


Figures

FIG. 1.
FIG. 1.
Incidence of detection of HIV-1 RNA after 1 year of therapy in relation to the patients' sex and antiretroviral comedications. *, P < 0.05; (*), P = 0.089 (multiple, non-α-corrected Fisher's exact tests). The results did not pass the logistic regression analysis step and are therefore to be regarded only as a tendency. ART, antiretroviral therapy; PI, protease inhibitors.
FIG. 2.
FIG. 2.
Main noncompartmental pharmacokinetic parameters of saquinavir obtained from 12-h pharmacokinetic profiles of 56 patients with HIV-1 infection. The parameter values found for patients who had no detectable HIV-1 RNA after 48 weeks of therapy did not significantly differ from those found for patients who had detectable levels of HIV-1 RNA after 48 weeks. Single values and box plots showing the median (horizontal solid line), the mean line (horizontal dotted line), and the lower boundary of the box indicate the 25th percentile; the upper boundary indicates the 75th percentile; and whiskers above and below the box indicate the 90th and 10th percentiles.
FIG. 3.
FIG. 3.
Steady-state saquinavir plasma concentration-versus-time profiles (median and interquartile range) obtained from 56 HIV-1-infected patients treated with 1,000 mg oral saquinavir plus 100 mg ritonavir separately for patients in whom HIV-1 RNA was detected in plasma after 48 weeks of therapy or not. Pharmacokinetic parameters Cmax, Cmin, AUC, Tlag, and Tmax did not differ statistically significantly between outcome groups (Fig. 2).
FIG. 4.
FIG. 4.
Correlations of maximum saquinavir plasma concentrations, Cmax, with patients' weights and with minimum and maximum plasma concentrations of ritonavir. All correlations were weak except for the correlation between Cmax,saquinavir and Cmin,saquinavir, for which the equation of linear regression is also given to provide a basis to estimate Cmax when only trough plasma concentrations of saquinavir (Cmin) are clinically available.
FIG. 5.
FIG. 5.
Interindividual variability of Cmax in 56 patients (left, closed symbols) taking 1,000 mg saquinavir plus 100 mg ritonavir twice daily and inter- and intraindividual variabilities for 14 patients (right, open symbols [one symbol per occasion]) who participated on two occasions of pharmacokinetic assessments. The intraindividual variabilities of Cmax were as high as their interindividual variabilities (P = 0.18). The values of individual patients are displayed with different symbols and are connected by dotted lines for better visibility.
FIG. 6.
FIG. 6.
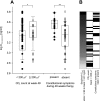
Saquinavir maximum plasma concentrations, Cmax, compared between patients with CD4 counts of <200 cells μl−1 and patients with CD4 counts of ≥200 cells μl−1 at week 48 and compared between patients with and without constitutional side effects. (A) Single values and box plots show the median (horizontal solid line) and the mean (horizontal dotted line), the lower boundary of the box indicates the 25th percentile, the upper boundary indicates the 75th percentile, and whiskers above and below the box indicate the 90th and 10th percentiles. The significance levels (*, P < 0.05; **, P < 0.01) have been obtained by pairwise comparisons with Wilcoxon tests. (B) Presence or absence of CD4 cell counts of <200 and constitutional side effects on an individual level. All 56 patients are sorted for saquinavir Cmax, shown in the left column (the minimum is at the bottom, in white; the maximum is at the top, in black; and intermediate values are in gray, darkening with increasing Cmax). Each individual has a separate line connecting their individual values of Cmax (grayscale) with those of the presence (black) or absence (white) of a CD4 cell count of <200 cells μl−1 after 48 weeks (middle column) and the presence (black) or absence (white) of constitutional symptoms through week 48 (right column). The figure shows that with increasing Cmax from bottom to top, the frequency of CD4 cell counts of <200 cells μl−1 decreases and the frequency of constitutional side effects increases, however, without a statistically significant association (P = 0.533).

References

    1. Antoniou, T., A. L. Tseng, R. P. van Heeswijk, S. E. Walker, P. Giguere, and E. J. Phillips. 2005. Steady-state pharmacokinetics and tolerability of indinavir-lopinavir/r combination therapy in antiretroviral-experienced patients. Ther. Drug Monit. 27:779-781. - PubMed
    1. Cameron, D. W., A. J. Japour, Y. Xu, A. Hsu, J. Mellors, C. Farthing, C. Cohen, D. Poretz, M. Markowitz, S. Follansbee, J. B. Angel, D. McMahon, D. Ho, V. Devanarayan, R. Rode, M. Salgo, D. J. Kempf, R. Granneman, J. M. Leonard, and E. Sun. 1999. Ritonavir and saquinavir combination therapy for the treatment of HIV infection. AIDS 13:213-224. - PubMed
    1. Casado, J. L., S. Moreno, K. Hertogs, F. Dronda, A. Antela, P. Dehertogh, M. J. Perez-Elias, and A. Moreno. 2002. Plasma drug levels, genotypic resistance, and virological response to a nelfinavir plus saquinavir-containing regimen. AIDS 16:47-52. - PubMed
    1. Dragsted, U. B., J. Gerstoft, C. Pedersen, B. Peters, A. Duran, N. Obel, A. Castagna, P. Cahn, N. Clumeck, J. N. Bruun, J. Benetucci, A. Hill, I. Cassetti, P. Vernazza, M. Youle, Z. Fox, and J. D. Lundgren. 2003. Randomized trial to evaluate indinavir/ritonavir versus saquinavir/ritonavir in human immunodeficiency virus type 1-infected patients: the MaxCmin1 Trial. J. Infect. Dis. 188:635-642. - PubMed
    1. Gatti, G., A. Di Biagio, R. Casazza, C. De Pascalis, M. Bassetti, M. Cruciani, S. Vella, and D. Bassetti. 1999. The relationship between ritonavir plasma levels and side-effects: implications for therapeutic drug monitoring. AIDS 13:2083-2089. - PubMed

MeSH terms