. 2008 Feb;24(1):37-55.
doi: 10.1007/s10827-007-0040-z. Epub 2007 Jun 19.

Using phase resetting to predict 1:1 and 2:2 locking in two neuron networks in which firing order is not always preserved

Affiliations

Using phase resetting to predict 1:1 and 2:2 locking in two neuron networks in which firing order is not always preserved

Selva K Maran et al. J Comput Neurosci. 2008 Feb.

Abstract

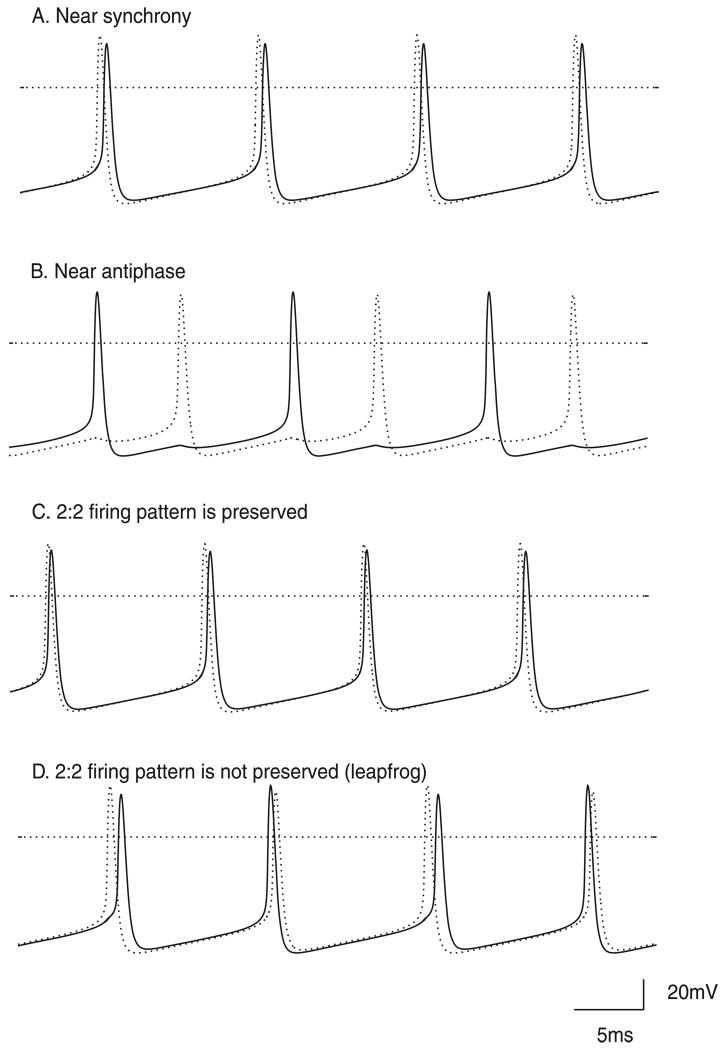
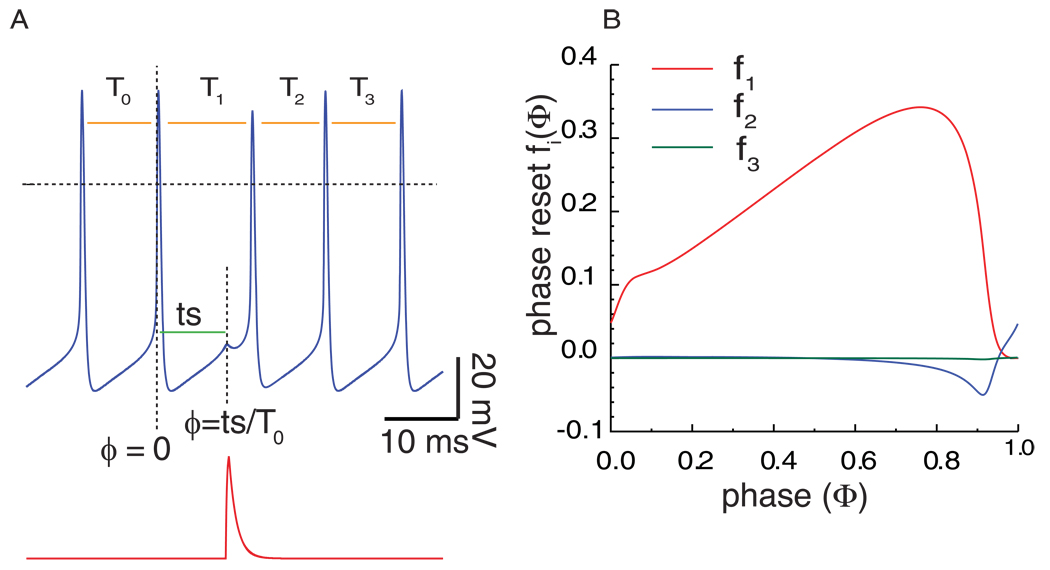
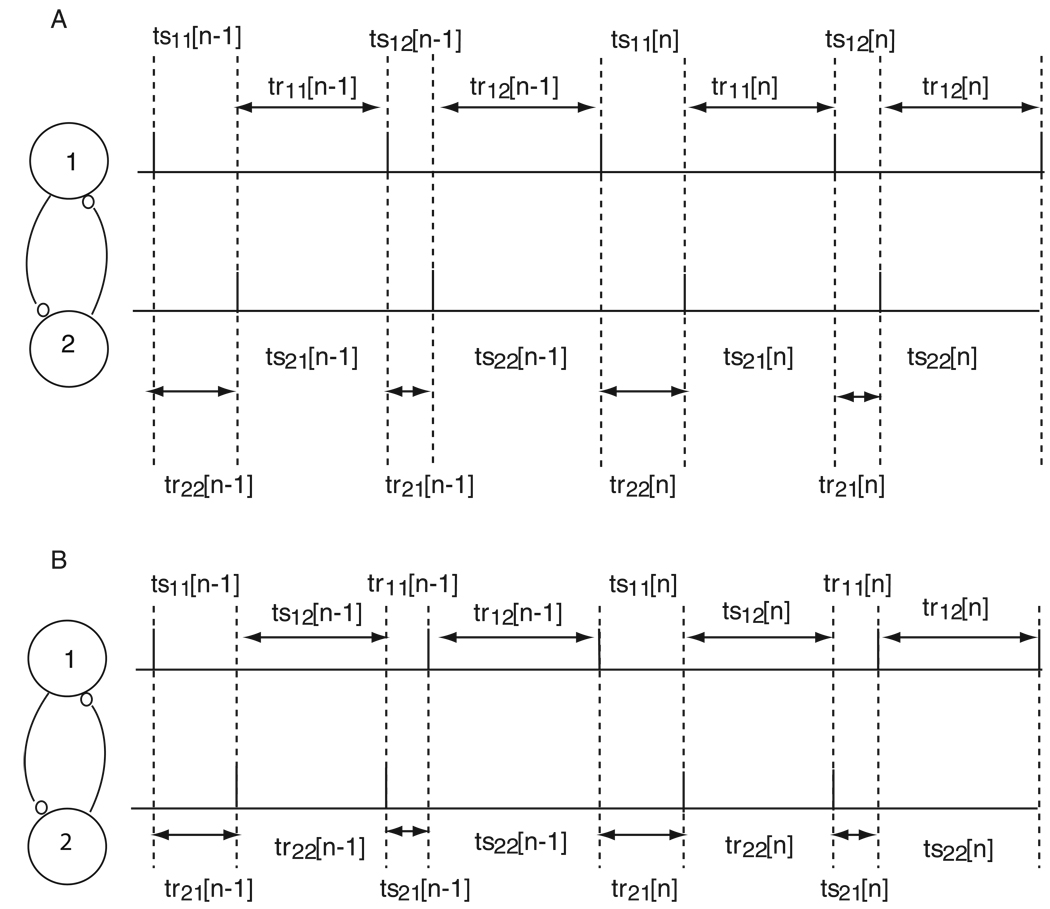
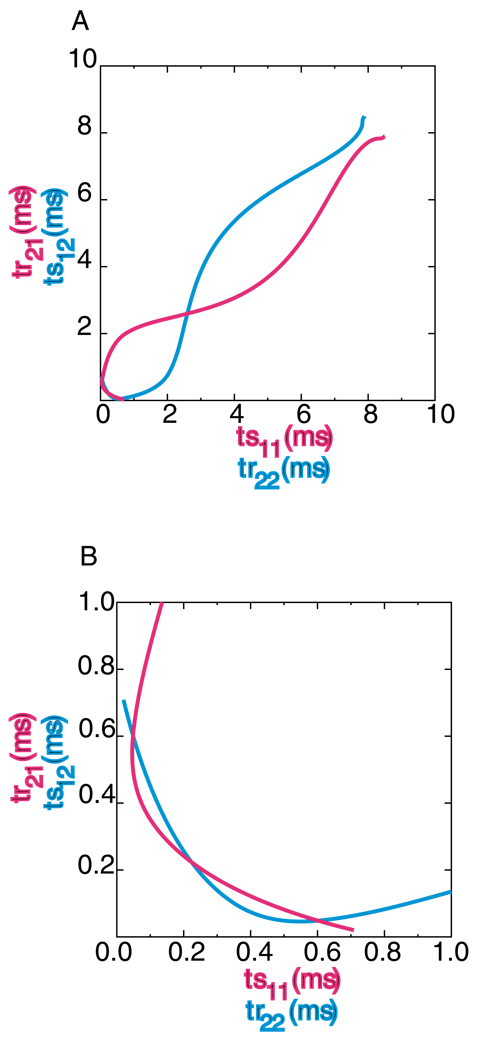
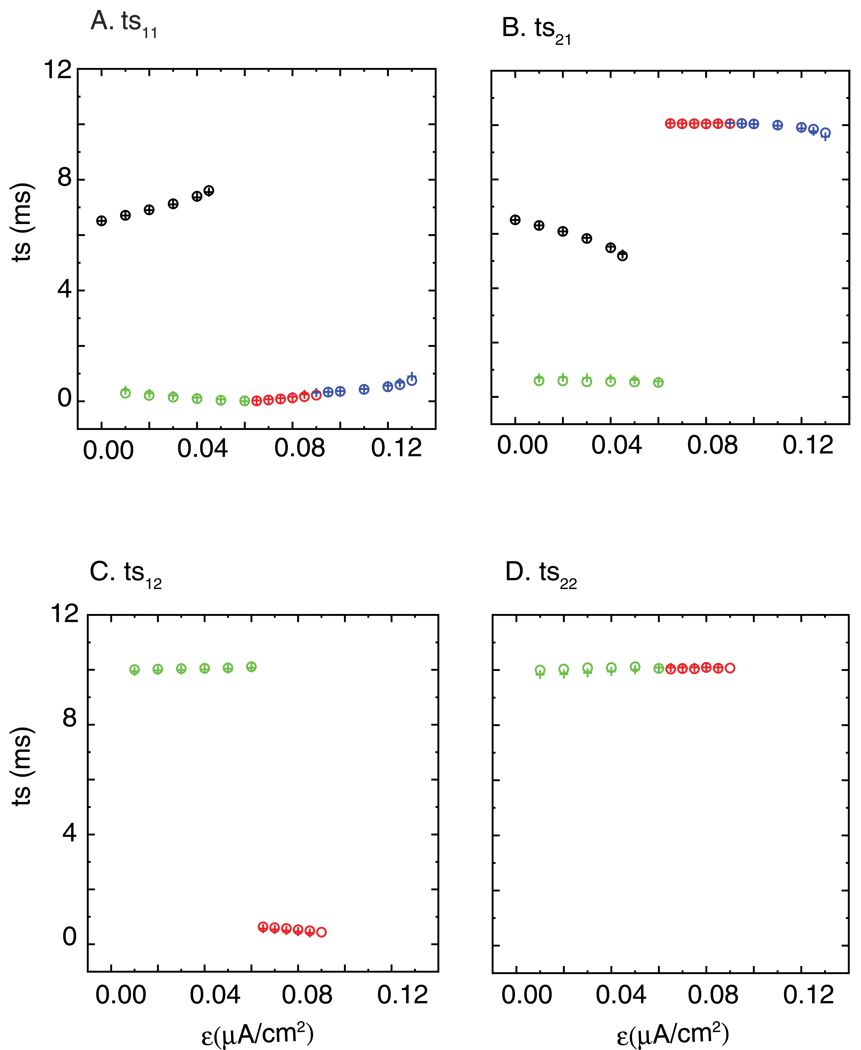
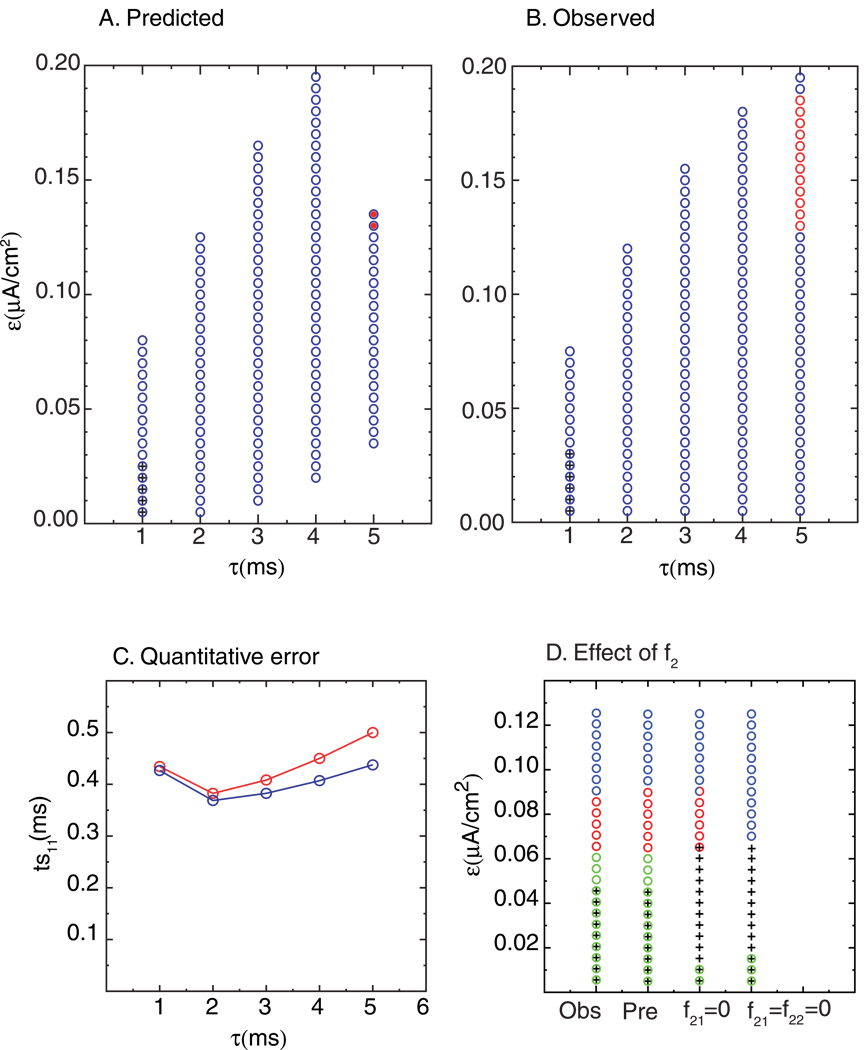
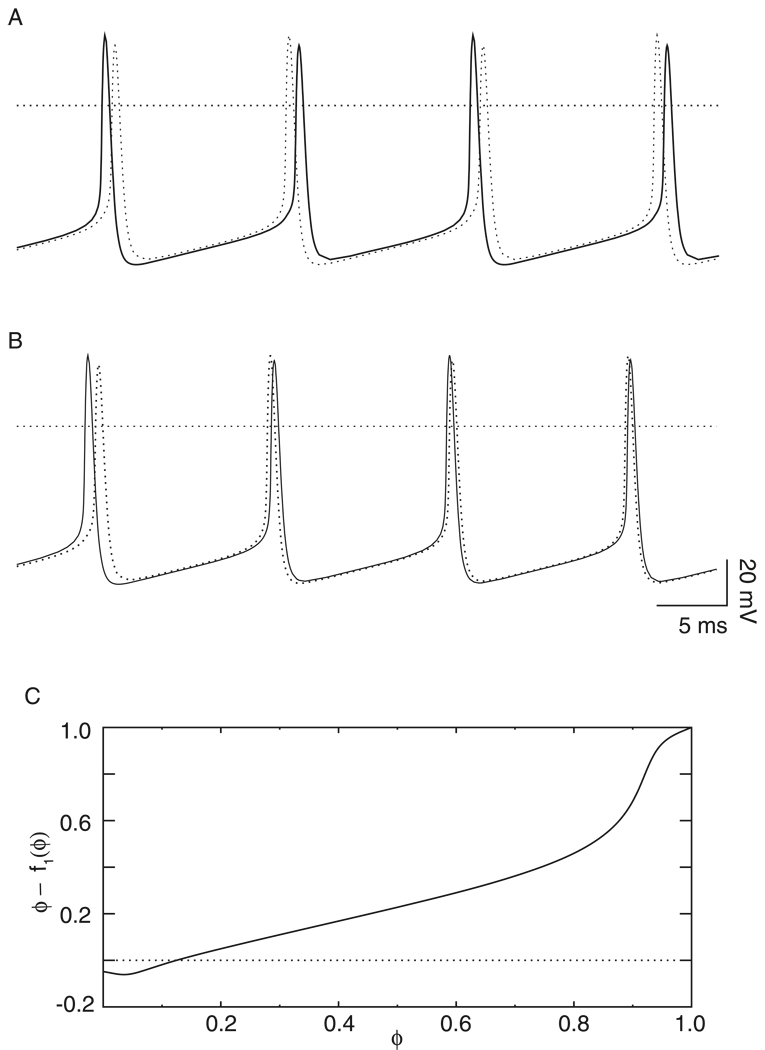
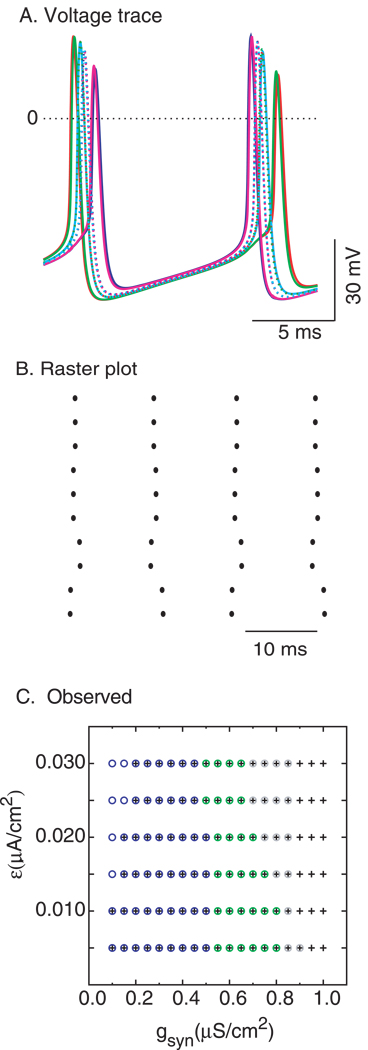
Our goal is to understand how nearly synchronous modes arise in heterogenous networks of neurons. In heterogenous networks, instead of exact synchrony, nearly synchronous modes arise, which include both 1:1 and 2:2 phase-locked modes. Existence and stability criteria for 2:2 phase-locked modes in reciprocally coupled two neuron circuits were derived based on the open loop phase resetting curve (PRC) without the assumption of weak coupling. The PRC for each component neuron was generated using the change in synaptic conductance produced by a presynaptic action potential as the perturbation. Separate derivations were required for modes in which the firing order is preserved and for those in which it alternates. Networks composed of two model neurons coupled by reciprocal inhibition were examined to test the predictions. The parameter regimes in which both types of nearly synchronous modes are exhibited were accurately predicted both qualitatively and quantitatively provided that the synaptic time constant is short with respect to the period and that the effect of second order resetting is considered. In contrast, PRC methods based on weak coupling could not predict 2:2 modes and did not predict the 1:1 modes with the level of accuracy achieved by the strong coupling methods. The strong coupling prediction methods provide insight into what manipulations promote near-synchrony in a two neuron network and may also have predictive value for larger networks, which can also manifest changes in firing order. We also identify a novel route by which synchrony is lost in mildly heterogenous networks.


Figures

Figure 1
Figure 1. Typical modes exhibited in a 2 neuron network
A. 1P near synchronous mode with 1:1 locking and alternating firing. B. Another 1:1 locking with alternating firing near antiphase. C. 2P mode with 2:2 locking and alternating firing in which the order remains constant. D. A type of 2P mode in which the firing order changes each cycle in a “leapfrog” fashion. A, C and D are “nearly synchronous” while B is not. The parameter values were gsyn = 0.35 mS/cm2 and τsyn = 1 ms, Iapp = 2.0 µA/cm2 with ε= 0.11µA/cm2 for panel A, 0.04 µA/cm2 for panel B, 0.082 µA/cm2 for panel C, and 0.015 µA/cm2 for panel D. The dotted lines indicate 0 mV.
Figure 2
Figure 2. Phase resetting curve
A. The phase resetting curve is generated using an action potential from the presynaptic neuron as the perturbation. The unperturbed cycle period is T0. The duration of the cycle that contains the perturbation is T1, the subsequent one is T2, and the one after that is T3. The phase at which a stimulus is received is φ = ts/Pi, where Pi is the intrinsic period of the postsynaptic neuron and ts is the time interval between the last action potential and the synaptic input perturbation. The phase resetting curve (PRC) is given by fi(φ) = (Ti−T)/T. The dotted line indicates 0 mV. The red trace shows the timing of the perturbation in synaptic conductance produced by a presynaptic action potential. B. Characteristic shapes of the f1(φ), f2(φ), and f3(φ) phase resetting curves. Note that f3(φ) is nearly zero, and that the sum of f1(φ) and f2(φ) is continuous at 0 and 1. The parameter values were gsyn = 0.35 mS/cm2 and τsyn = 1 ms, Iapp =2.0 µA/cm2 and ε=0.07 µA/cm2. The PRC is given for the faster neuron.
Figure 3
Figure 3. Firing pattern for 2:2 lockings
A. Firing order is preserved. The tsij in the figure above represent stimulus intervals and the trij represent recovery intervals (see text). B. Firing order is not preserved. Note that the firing order changes on every cycle. The definitions for the tsij and trij are different than in A because the assumed firing pattern is different (see text).
Figure 4
Figure 4. Graphical prediction of 2:2 locking with firing order preserved
The parameter values were gsyn = 0.35 mS/cm2 and τsyn = 1 ms, Iapp = 2.0 µA/cm2 and ε=0.07 µA/cm2. A. The intersections of the two curves indicate intervals at which all four periodicity criteria are satisfied. A different set of three of the four criteria are satisfied on each curve. B. Magnification of the region around the origin in panel A. This graphical method is symmetric because the existence criteria are symmetric with respect to switching the indices indicating inputs 1 and 2.
Figure 5
Figure 5. Graphical prediction of 2:2 locking with firing order not preserved
The parameter values were gsyn = 0.35 mS/cm2, τsyn = 1 ms, Iapp = 2.0 µA/cm2 and ε=0.03 µA/cm2. A different set of three of the four periodicity criteria for this mode are satisfied on each curve. The axes of the plot are structured so that at the intersection of the curves all four criteria are met.
Figure 6
Figure 6. Application of weak coupling theory
A. Conductance waveform (black), first order iPRC (red), second order iPRC (blue). Wang and Buzsáki model with Iapp = 2 µA/cm2 and tau =1 ms. B. Coupling function G(ϕ) at ε = 0.045 µA/cm2 with gsyn = 0.25mS/cm2 (solid black curve) and with gsyn = 0.20 mS/cm2 (dot-dashed black curve). The dotted line indicates 0 and the dashed line indicates the normalized frequency difference between the oscillators.
Figure 7
Figure 7. Qualitative prediction of the firing pattern as gsyn is varied
Patterns include antiphase locking (+), near synchronous 1:1 locking (blue circles), near synchronous alternating 2P locking (red circles), and near synchronous 2P leapfrog locking (green circles). If more than one symbol is plotted, bistability is indicated. The parameter values were Iapp = 2.0 µA/cm2 and τsyn = 1 ms, and ε is also varied. A. Predicted patterns (Strong coupling method). B. Observed patterns. The gray circles indicate complex lockings that cannot be predicted by the graphical method. C. Predicted patterns (Weak coupling method).
Figure 8
Figure 8. Qualitative prediction of the firing pattern as Iapp is varied
Patterns include antiphase locking (+), near synchronous 1:1 locking (blue circles), near synchronous alternating 2P locking (red circles), and near synchronous 2P leapfrog locking (green circles). If more than one symbol is plotted, bistability is indicated. The parameter values were gsyn = 0.35 mS/cm2 and τsyn = 1 ms, and ε is also varied. A. Predicted patterns. B. Observed patterns. C and D. Bifurcation diagram. C. The predicted stimulus interval values of the faster neuron (ts1j) are shown at gsyn =0.35 mS/cm2, τsyn = 1 ms, Iapp = 1.8 µA/cm2 as ε is varied. D. The observed values at the same parameter values used in figure 8C.
Figure 9
Figure 9. Quantitative prediction of the firing pattern
The predicted stimulus times (open circles) are compared with the observed stimulus times (+) at each value of ε for the column in Fig. 8A and B labeled Iapp = 2.0 µA/cm2. The other parameters remain gsyn = 0.35 mS/cm2 and τsyn = 1 ms as shown in Fig. 8. Antiphase (black), near synchrony (blue), alternating 2P (red), leapfrog 2P (green). The ts12 and ts22 for antiphase and near synchronous 1P are not shown in figure because they are the same as ts11 and ts21. The quantitative fit to the firing intervals is fairly accurate.
Figure 10
Figure 10. Degradation of predictions as the time constant is increased or the second order resetting is neglected
A,B and C. Effect of increased time constant: The parameter values were gsyn = 0.2 mS/cm2 and Iapp = 2 µA/cm2, and ε is varied. A. Predicted modes. B. Observed modes. C. The predicted ts11 interval (blue) is plotted versus observed ts11 (red) as τsyn is varied at ε = 0.07 µA/cm2. D. Prediction without second order resetting. The parameter values are gsyn =0.35 mS/cm2, τsyn = 1 ms, Iapp =2 µA/cm2. The first column (Obs) shows the observed modes, the second column (Pre) shows the predicted modes when the second order resetting of both neurons is included, the third shows the prediction when the second order resetting of faster neuron is zero (f21=0), and the fourth (f21=f22=0) shows the prediction when the second order resetting of both neurons is zero. The qualitative patterns include near synchronous 1:1 locking (blue circles), near synchronous alternating 2P locking (red circles), and near synchronous 2P leapfrog locking(green circles). The blue circles filled with red indicate a prediction of bistability between two modes.
Figure 11
Figure 11. Homogeneity does not guarantee that the firing order is preserved
A. Leapfrog 2:2 locking of identical oscillators. The parameters were gsyn = 0.35 mS/cm2, Iapp = 2.0 µA/cm2, τsyn = 1 and ε=0. B. Convergence to synchrony of identical oscillators in which the firing order is not preserved. The parameters were gsyn = 0.25 mS/cm2, Iapp = 2.0 µA/cm2, τsyn = 1 and ε=0. C. The new phase versus old phase function generated at gsyn = 0.35 mS/cm2 and τsyn = 1 ms, and Iapp = 2.0 µA/cm2 (ε=0.0 µA/cm2).
Figure 12
Figure 12. 2:2 modes in 10 neuron network
A. Membrane potential. Each different trace corresponds to the voltage waveform of a single neuron. The parameter values are gsyn = 0.8/9 mS/cm2, Iapp = 2.0 µA/cm2, τsyn = 1 ms, and ε =0.01 µA/cm2. The values of applied current (Istim) for the each of the ten neurons were Iapp -ε+ (n 2 ε)/9, where n ranges from 0 to 9. B. Raster Plot. C. Qualitative prediction of the firing pattern as gsyn is varied. The parameter values are Iapp = 2.0 µA/cm2 and τsyn = 1 ms. The following modes are observed- 1:1 near synchronous (blue circles), the 2:2 leapfrog modes (green circles), anti-phase (black plus signs) and complex lockings (gray circles).

References

    1. Bartos M, Vida I, Frotscher M, Geiger JRP, Jonas P. Rapid signaling at inhibitory synapses in a dentate gyrus interneuron network. J. Neurosci. 2001;21:2687–2698. - PMC - PubMed
    1. Bartos M, Vida I, Frotscher M, Meyer M, Monyer H, Geiger JRP, Jonas P. Fast synaptic inhibition promotes synchronized gamma oscillations in hippocampal interneuron networks. Proc Natl Acad Sci USA. 2002;99:13222–13227. - PMC - PubMed
    1. Canavier CC, Baxter DA, Clark JW, Byrne JH. Control of multistability in ring circuits of oscillators. Biol. Cybernetics. 1999;80:87–102. - PubMed
    1. Canavier CC, Butera RJ, Dror RO, Baxter DA, Clark JW, Byrne JH. Phase response characteristics of model neurons determine which patterns are expressed in a ring circuit model of gait generation. Biol. Cybernetics. 1997;77:367–380. - PubMed
    1. Dror RO, Canavier CC, Butera RJ, Clark JW, Byrne JH. A mathematical criterion based on phase response curves for stability in a ring of coupled oscillators. Biol. Cybern. 1999;80:11–23. - PubMed

Publication types