. 2007 May;35(5):802-16.
doi: 10.1016/j.exphem.2007.02.013.

Sustained in vitro trigger of self-renewal divisions in Hoxb4hiPbx1(10) hematopoietic stem cells

Affiliations

Sustained in vitro trigger of self-renewal divisions in Hoxb4hiPbx1(10) hematopoietic stem cells

Sonia Cellot et al. Exp Hematol. 2007 May.

Abstract

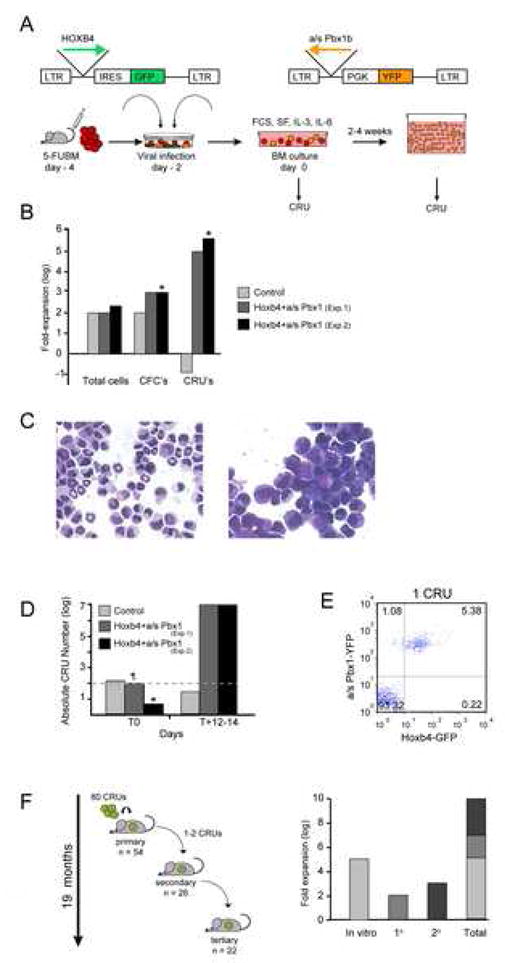
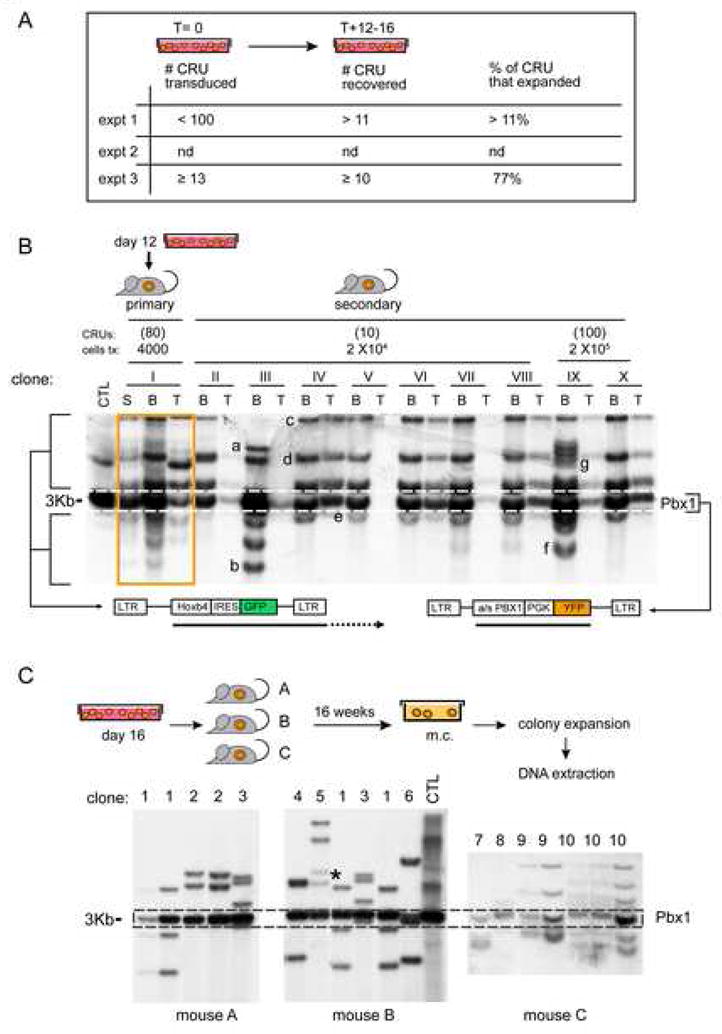
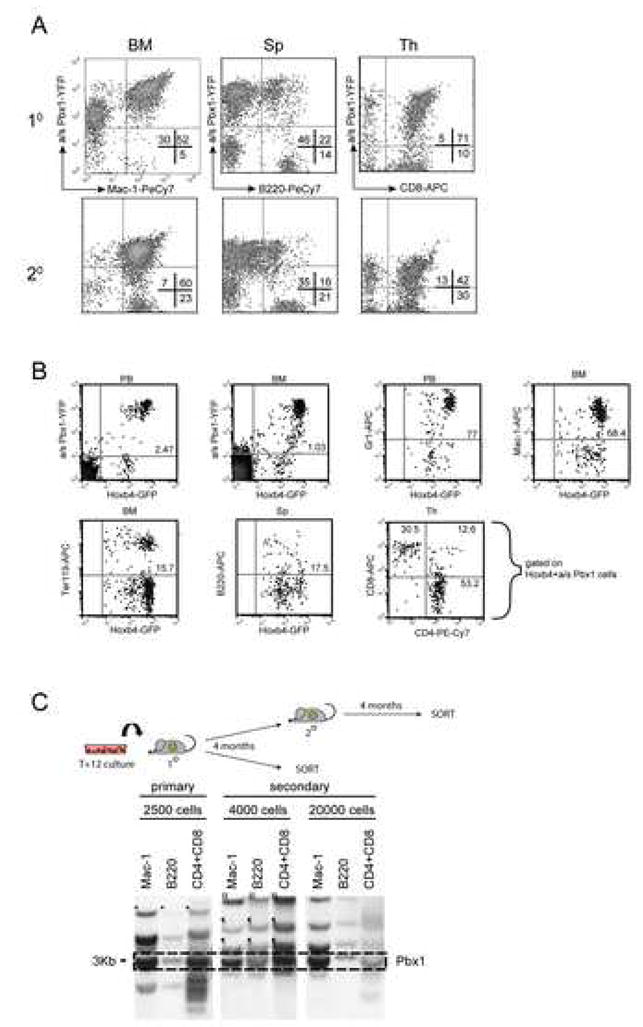
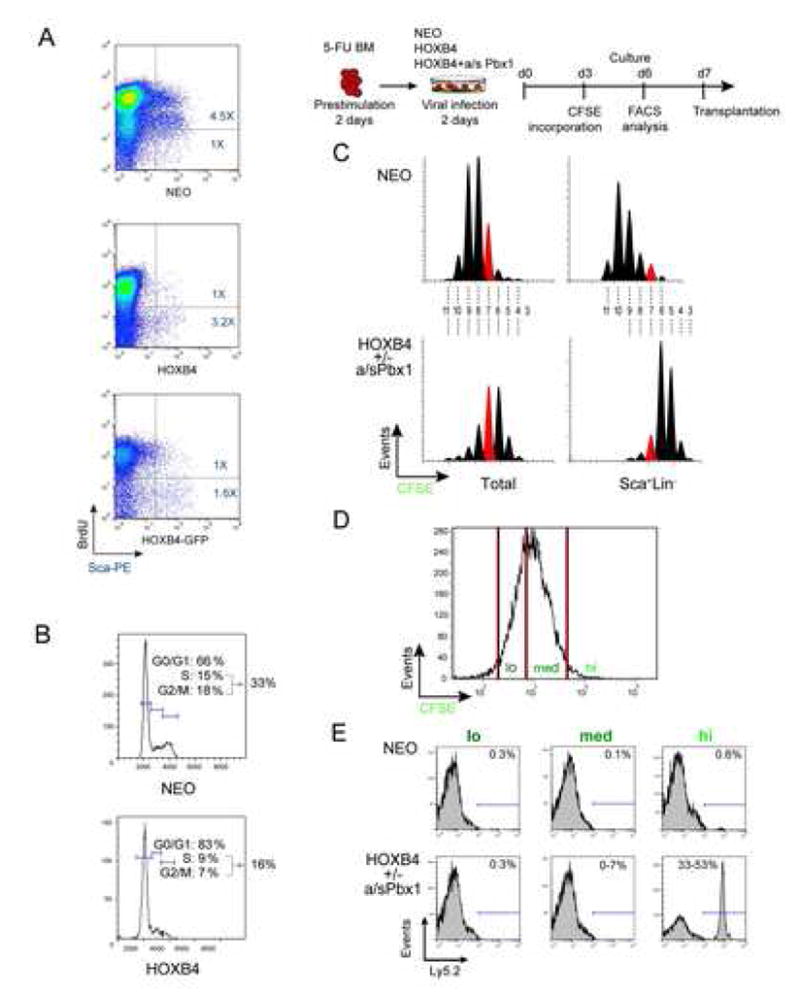
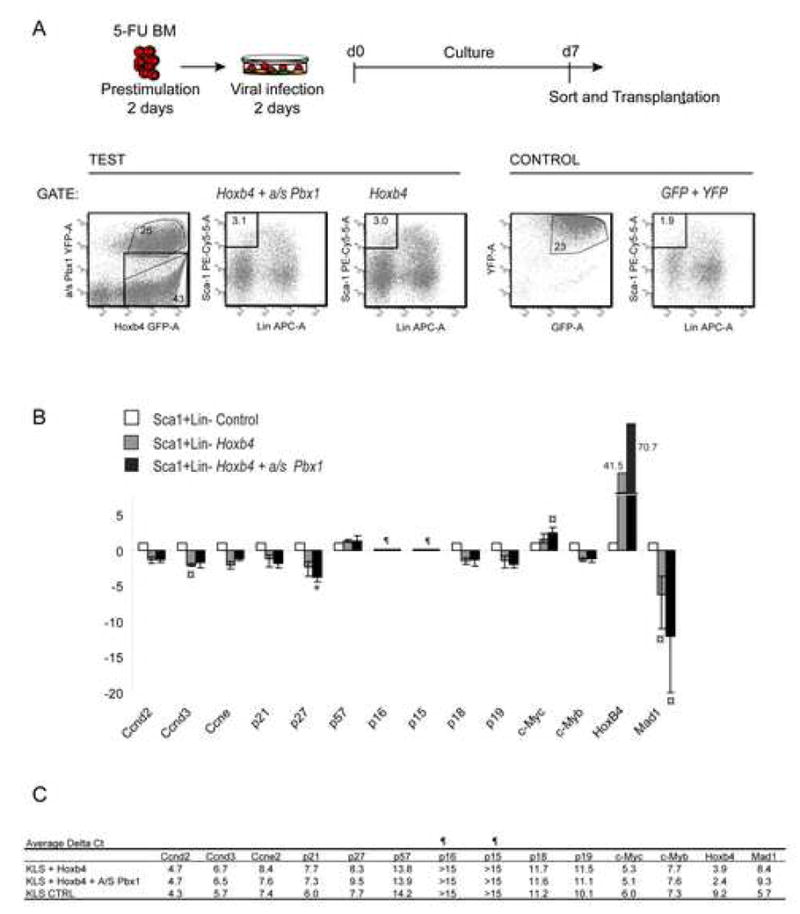
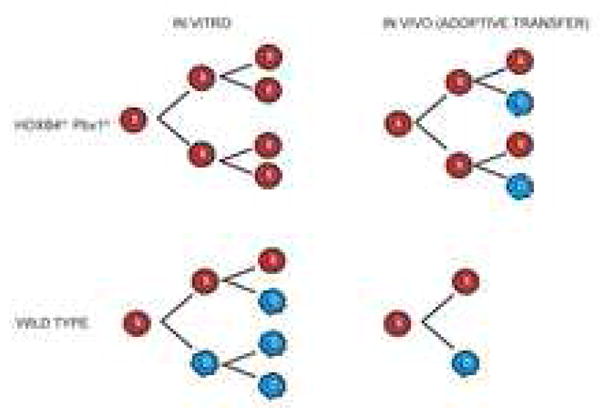
Factors that trigger and sustain self-renewal divisions in tissue stem cells remain poorly characterized. By modulating the levels of Hoxb4 and its co-factor Pbxl in primary hematopoietic cells (Hoxb4hiPbxl(10) cells), we report an in vitro expansion of mouse hematopoietic stem cells (HSCs) by 105-fold over 2 weeks, with subsequent preservation of HSC properties. Clonal analyses of the hematopoietic system in recipients of expanded HSCs indicate that up to 70% of Hoxb4hiPbxl(10) stem cells present at initiation of culture underwent self-renewal in vitro. In this setting, Hoxb4 and its co-factor did not promote an increase in DNA synthesis, or a decrease in doubling time of Scal+Lin- cells when compared to controls. Q-PCR analyses further revealed a downregulation of Cdknlb (p27Kipl) and Mxdl (MadI) transcript levels in Hoxb4hiPbxl(l0) primitive cells, accompanied by a more subtle increase in c-myc and reduction in Ccnd3 (Cyclin D3). We thus put forward this strategy as an efficient in vitro HSC expansion tool, enabling a further step into the avenue of self-renewal molecular effectors.


Figures

Figure 1
Figure 1
In vitro expansion of Hoxb4hiPbx1lo HSC (A) Diagrammatic representation of retroviral vectors and experimental strategy used in these experiments. In total 3 independent experiments (Exp. 1–3) were performed. CRU frequency in cultures were assessed at different times (T) using limit dilution assays as follows: Exp. 1: T0; T+12, T+19; Exp. 2: T+3; T+14; Exp. 3: T0, T+7, T+16, T+21*; T+28;. At each time point, between 20–35 primary recipients were transplanted per condition, except for * where only 3 mice were used. FCS: Fetal Calf Serum; SF: Steel Factor (B) Differential impact of Hoxb4 over-expression on the expansion of distinct cell fractions following 2 weeks of ex vivo culture. From Exp. 1 and 2. CFC: colony-forming cell, CRU: competitive repopulating unit. *To calculate fold-expansion in Exp. 2, CFCs and CRUs at initiation of culture were considered to be equivalent to those of Exp. 1, even though 1/3 of mice or 1/10 of BM cells were used to begin the experiment. Hence, the fold-increase may be an underestimate. (C) Wright stain of cellular preparations obtained from T+14 cultures initiated with GFP-transduced cells (left panel) or Hoxb4hiPbx1lo cells (right panel). Note the reduction of differentiated cells (e.g., ring neutrophils) in right panel. Representative example shown from Exp. 2. (D) Histogram depicting the absolute HSC (CRU) numbers increment in the cultures initiated with GFP-transduced cells versus those with Hoxb4hiPbx1lo cells. X-axis refers to number of days cells from Exp. 1 and 2 were kept in culture. ¶ Total CRU value at T0 also includes untransduced and singly transduced cells. * Estimated value according to CRU frequency of Exp. 1, see legend of (B). (E) Representative FACS profile of GFP and YFP expression in peripheral blood (PB) cells from a primary mouse recipient of 5 Hoxb4hiPbx1lo expanded cells after 14 days of culture. Recipient (Exp. 2) was analyzed at 16 weeks post transplant. (F) Summary of CRU expansion in serial transplantations of Hoxb4hiPbx1lo BM cells revealing a cumulative 1010-fold in vitro and in vivo expansion over a period of 19 months. From Exp. 1.
Figure 2
Figure 2
Polyclonal and pluripotent character of expanded Hoxb4hiPbx1lo HSCs (A) Summary of Hoxb4hiPbx1lo CRUs present at initiation (T0) and termination (T+12-16) of culture in the reported experiments, with CRUs at output over input numbers expressed as percentages on the far right column. T=0 CRUs calculated using CRU frequencies and transduction rates (Exp. 1) or Southern Blot analyses of BM cells of primary recipients (Exp. 3). Note that CRU numbers at T0 (<100) also include untransduced and singly transduced cells, hence the possible over estimation of Hoxb4hiPbx1lo CRUs. T+12-16 CRUs calculated using Southern Blot analyses of BM cells of secondary recipients (Exp. 1) or individually expanded myeloid colonies derived from BM cells of primary recipients (Exp. 3). (B) Clonal analyses of hemopoietic reconstitution were also performed on 1° (mouse I) and 2° (mice II-X) recipients of Hoxb4+a/sPbx1 BM cells from Exp. 1. Mice were sacrificed 4 months post transplantation. DNA extracted from BM, spleen and thymus was digested with HindIII and EcoRI, which released a constant fragment of 3 kb representing the integrated Pbx1 provirus (see dotted line) and unique fragments for the integrated Hoxb4 virus (see autoradiographic signals identifying specific integration sites). Hence, a GFP probe generated a single autoradiographic signal for all a/sPbx1 proviral integrations (as indicated by the dotted lines), together with multiple bands denoting each Hoxb4 proviral integration event (see bottom diagram). A primary recipient of 4000 cells of T+12 in vitro culture (0.0007% of the total cell population), mouse I, displayed an oligoclonal pattern of Hoxb4 integration, reflecting the presence of several doubly transduced HSCs in the in vitro culture. Individual clones, labelled from “a” to “g”, can be distinguished among 2° transplant recipients of BM cells from mouse I (clones “h” to “k” are not shown in this blot). Note that a given clone was sometimes present in more than one 2° recipient, see for example clone “f” in mice III and IX, suggesting in vivo self-renewal of this HSC in the 1° donor mouse. (C) Primary recipients of day 16 in vitro culture Hoxb4hiPbx1lo cells (from Exp. 3) were sacrificed at 4 months post transplantation, their respective BM cells plated in methylcellulose (m.c.), and individual colonies were then expanded. Southern Blot analyses of genomic DNA extracted from these clones are presented; DNA was digested with restriction enzymes (HindIII and EcoRI) as in (B). Individual clones, labeled from “1” to “10”, can be distinguished among 3 transplant recipients of BM cells. Note that a given clone was sometimes present in different recipients, suggesting in vitro self-renewal of the parent HSC. Mice were sacrificed 4 months post transplantation to ensure in vivo exhaustion of transduced progenitors, and thus assure that each colony forming cell (CFC) in methylcellulose (m.c.) was stem cell derived. * Probable contamination from clone no 2.
Figure 3
Figure 3
Differentiation potential analysis of in vitro and in vivo expanded CRUs. (A) Representative FACS profiles of primary (top) and secondary (bottom) recipients of in vitro cultured T+12 Hoxb4hiPbx1lo cells (Exp. 1) showing myeloid (Mac-1) and lymphoid (B220, CD8) differentiation. Animals were sacrificed 4 months post transplantation. BM: bone marrow, Sp: spleen, Th: thymus. (B) FACS prolifes of bone marrow (BM) and peripheral blood (PB) cells from a representative primary recipient of 500 T+14 Hoxb4hiPbx1lo expanded cells (Exp. 2), 14 months post transplantation. For the different lineage marker shown on the Y-axis (Gr1, Mac-1, Ter119, B220, CD8) and on the X-axis (CD4), gates are set on double positive GFP:YFP (Hoxb4:a/sPbx1) cells. (C) Terminal differentiation capacity of in vitro expanded HSCs was further evaluated in a 1° recipient (Exp. 1) of 2,500 T+12 expanded cells and in serially transplanted 2° recipients (left panel). Both, 1° and 2° recipients were sacrificed at 4 months post transplantation, and their hemopoietic cells sorted in B (B220+), T (CD4+/CD8+) lymphoid and (Mac-1+) myeloid lineages. Genomic DNA extracted from these populations was analyzed by Southern blot (right panel) as described in Fig 2A. Within a given animal, a common clone could be identified in all the aforementioned cell types, testifying that a common parental HSC gave rise to this differentiated lympho-myeloid progeny.
Figure 4
Figure 4
Division tracking of primitive hemopoietic cells (A) In vitro BrdU incorporation assay performed on BM cells transduced with the indicated retroviruses and maintained in culture for 8 days. BrdU incorporation was estimated at ~80% in control and Hoxb4-transduced cells (total population). Hoxb4-transduced Sca1+ cells contained a larger proportion of units that have not engaged in DNA synthesis than comparable controls (see ratio of upper/lower right quadrants in 1st (control) versus 2nd and 3rd (Hoxb4) panels). Representative result from n=1 experiment. (B) Cell cycle phase distributions of Sca1+Lin cells in culture initiated with control or Hoxb4-transduced cells reinforce the results obtained in “A” since a smaller proportion of Hoxb4-transduced cells were found in S/G2/M than in control cultures. Representative result from n=3 independent experiments. (C) CFSE labeling of Hoxb4hiPbx1lo versus control BM cells at day 3 of culture, and FACS profiles of cells analyzed at day 6 are shown. Number of events (y axis) is displayed against CFSE intensity (x axis), for both total cell populations (left panels) and Sca1+Lin subgroups. Similar patterns of division were observed in Hoxb4hi and Hoxb4hiPbx1lo groups, namely, increased proportions of cells with high fluorescence intensity or low numbers of divisions in the Sca1+Lin fraction, against a more Gaussian type of fluorescence distribution in the overall cell population (generation 7 peak illustrated in red for comparison), and in the control condition. When comparing Sca1+Lin subgroups of Hoxb4hiPbx1lo cells to that of control, 95% of cells in the former group had divided ≤7 times, whereas 80% of cells in the latter group divided ≥7 times. Representative result from n=2 independent experiments performed in triplicate. (D) Gates used to sort CSFE labeled cells on day +7 of culture. Sorted cells were transplanted as depicted in “C” and results of this experiment are reported in “E”. (E) CFSE treated cells described in ”D” according to CFSE fluorescence intensity levels, with arbitrarily set gates of high, medium and low intensity. The CFSEhigh cell fraction represented 1–2% of cells in all conditions examined (neo, Hoxb4 or Hoxb4+a/sPbx1 transduced cells). Cell subpopulations characterized by a distinct CFSE fluorescence intensity were evaluated for repopulation activity by transplanting between 50 to 5000 cells in myeloablated recipients, which were analyzed 3 months after transplantation. Long-term repopulating cells are found in greatest proportion in the CFSEhigh fractions, irrespective of genotype. Similar results were obtained for Hoxb4 or Hoxb4+a/sPbx1 groups. N=2 independent experiments with 3 recipients transplanted per CSFE fraction with representative shown.
Figure 5
Figure 5
Expression profiles of cell cycle related genes in primitive cells (A) Sca+Lin- BM cells were sorted on T+7 of in vitro culture for the single transduced Hoxb4-GFP cell population, the double transduced Hoxb4-GFP + a/s Pbx1-YFP fraction (see test FACS profiles on the left) as well as for control GFP + YFP cells (see control FACS profiles on the right). Retroviral infections and cultures were performed in triplicates according to our standard protocol for 5-FU BM cells as described above (n= total of 60 mice). (B) Analysis of selected genes by Quantitative RT-PCR. Results are presented as relative fold-differences in m-RNA expression as compared to control Sca+Lin- cell fraction. For all triplicate culture conditions, genes were analyzed in duplicates, and mean delta Ct values were compared between groups and their significance assed by independent t-test. Statistically significant differences are highlighted by a symbol. ¤ p<0.05, * p<0.005. For both Cdkn1a and Cdkn1c, one of the triplicate values was disregarded in the Hoxb4 group because it was considered as an outlier (delta Ct value differed by ≥ 4 units). (C) Average delta Ct (threshold cycle) values for all genes. As an assessment of RNA quality, Ct values for the endogenous control gene (GAPDH) ranged between 15.3 and 26. ¶ Genes were considered not to be expressed for delta Ct values > 15.
Figure 6
Figure 6
Model for in vitro and in vivo self-renewal division of Hoxb4hiPbx1lo HSCs Hoxb4 and Pbx1 preferentially alter stem cell fate in vitro with increased probability of symmetrical self-renewal divisions of expansion, for the vast majority of HSCs present in culture, rather than accelerating the division rates of a few stem cells. Following a brief period of expansion in vivo post adoptive transfer, they can revert to asymmetrical divisions of maintenance and respond to physiological cues of the niche.

Similar articles

Cited by

References

    1. Moore KA, Lemischka IR. Stem cells and their niches. Science. 2006;311:1880–1885. - PubMed
    1. Pawliuk R, Eaves C, Humphries RK. Evidence of both ontogeny and transplant dose-regulated expansion of hematopoietic stem cells in vivo. Blood. 1996;88:2852–2858. - PubMed
    1. Sauvageau G, Thorsteinsdottir U, Eaves CJ, et al. Overexpression of HOXB4 in hematopoietic cells causes the selective expansion of more primitive populations in vitro and in vivo. Genes Dev. 1995;9:1753–1765. - PubMed
    1. Iscove NN, Nawa K. Hematopoietic stem cells expand during serial transplantation in vivo without apparent exhaustion. Curr Biol. 1997;7:805–808. - PubMed
    1. Thorsteinsdottir U, Sauvageau G, Humphries RK. Enhanced in vivo regenerative potential of HOXB4-transduced hematopoietic stem cells with regulation of their pool size. Blood. 1999;94:2605–2612. - PubMed

Publication types

MeSH terms