. 2007 Jun 26;104(26):10859-64.
doi: 10.1073/pnas.0701967104. Epub 2007 Jun 19.

Monomeric G protein-coupled receptor rhodopsin in solution activates its G protein transducin at the diffusion limit

Affiliations

Monomeric G protein-coupled receptor rhodopsin in solution activates its G protein transducin at the diffusion limit

Oliver P Ernst et al. Proc Natl Acad Sci U S A. .

Abstract

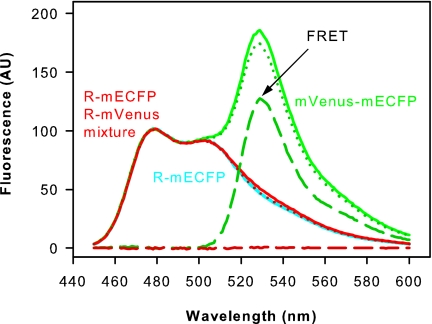
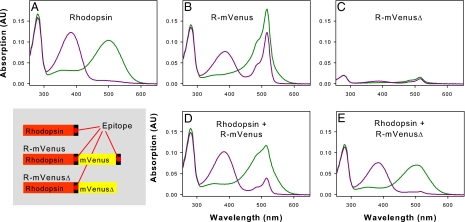
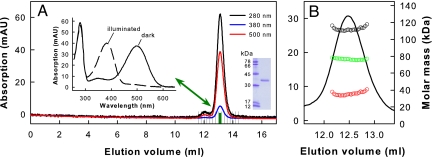
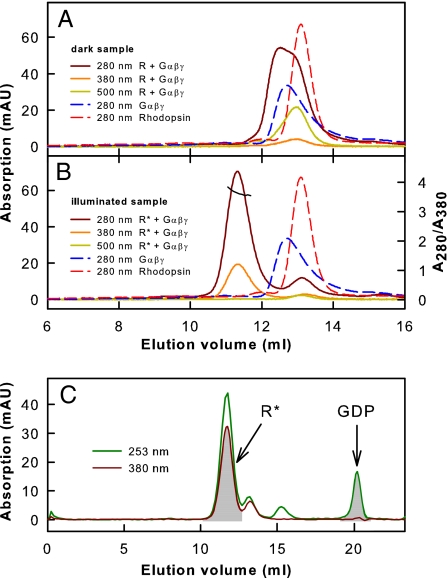
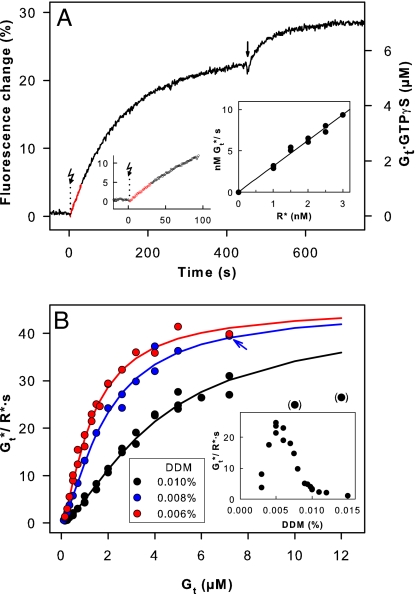
G protein-coupled receptors mediate biological signals by stimulating nucleotide exchange in heterotrimeric G proteins (Galphabetagamma). Receptor dimers have been proposed as the functional unit responsible for catalytic interaction with Galphabetagamma. To investigate whether a G protein-coupled receptor monomer can activate Galphabetagamma, we used the retinal photoreceptor rhodopsin and its cognate G protein transducin (G(t)) to determine the stoichiometry of rhodopsin/G(t) binding and the rate of catalyzed nucleotide exchange in G(t). Purified rhodopsin was prepared in dodecyl maltoside detergent solution. Rhodopsin was monomeric as concluded from fluorescence resonance energy transfer, copurification studies with fluorescent labeled and unlabeled rhodopsin, size exclusion chromatography, and multiangle laser light scattering. A 1:1 complex between light-activated rhodopsin and G(t) was found in the elution profiles, and one molecule of GDP was released upon complex formation. Analysis of the speed of catalytic rhodopsin/G(t) interaction yielded a maximum of approximately 50 G(t) molecules per second and molecule of activated rhodopsin. The bimolecular rate constant is close to the diffusion limit in the diluted system. The results show that the interaction of G(t) with an activated rhodopsin monomer is sufficient for fully functional G(t) activation. Although the activation rate in solution is at the physically possible limit, the rate in the native membrane is still 10-fold higher. This is likely attributable to the precise orientation of the G protein to the membrane surface, which enables a fast docking process preceding the actual activation step. Whether docking in membranes involves the formation of rhodopsin dimers or oligomers remains to be elucidated.


Conflict of interest statement

The authors declare no conflict of interest.

Figures

Fig. 1.
Fig. 1.
FRET experiments. Monomeric cyan or yellow variants of GFP fused to the opsin C terminus (R–mECFP and R–mVenus, respectively) were expressed separately and together in COS-1 cells, reconstituted with 11-cis-retinal, and purified. Normalized emission spectra (excitation at 420 nm) are shown for purified R–mECFP (cyan line), copurified R–mECFP/R–mVenus (red line), and a fusion protein consisting of mECFP and mVenus as positive FRET control (green line). The spectra of proteins containing an mVenus moiety were corrected for direct excitation of mVenus by the 420 nm excitation beam as described in Materials and Methods. FRET is reflected in the difference between the corrected spectra (dotted lines) and the spectrum of R–mECFP (cyan line). These difference spectra (broken lines) show that FRET only occurs in the mVenus–mECFP positive FRET control but not in the R–mECFP/R–mVenus sample. FRET also was lacking in copurified R–mECFP/R–mVenus after illumination of the sample for 15 s with orange light (data not shown).
Fig. 2.
Fig. 2.
UV/visible absorption spectra of rhodopsin and different rhodopsin–mVenus fusion proteins after expression in COS-1 cells, reconstitution with 11-cis-retinal and purification. The proteins contained one or two epitopes (internal and/or C-terminal) recognized by rho-1D4 antibody used for immunoaffinity purification. Spectra measured in the dark (green line) and after illumination for 15 s with orange light (purple line) are shown. (A) Rhodopsin. (B) R–mVenus. (C) R–mVenusΔ. (D) Copurified rhodopsin and R–mVenus (1:1 molar ratio of plasmids used for transfection). (E) Copurified rhodopsin and R–mVenusΔ (1:2 molar ratio of plasmids used for transfection). The small contribution of mVenus to the absorption at ≈516 nm is attributable to the weak affinity of the rho-1D4 antibody for the internal epitope (see C). The results show that fluorescent-protein-tagged rhodopsin lacking the C-terminal epitope tag does not copurify with coexpressed wild-type rhodopsin. Analogously, coexpression of R–mVenus and wild-type rhodopsin lacking the 1D4 epitope yielded spectra very similar to R–mVenus alone (data not shown).
Fig. 3.
Fig. 3.
SEC of rhodopsin purified from bovine disk membranes. (A) Typical chromatogram of rhodopsin purified in DDM detergent. The peak fraction highlighted in green was used for subsequent Gt activation experiments. Inset shows UV/visible absorption spectra of the highlighted fraction measured in the dark and after illumination for 15 s with orange light. This rhodopsin fraction typically had an A280/A500 ratio below 1.6, indicating a purity close to 100%. (Inset) SDS gel of purified rhodopsin (right lane). (B) Online molar mass determination of purified dark-state rhodopsin in 0.03% (wt/vol) DDM by SEC in combination with MALLS detection. The calculated molar masses are shown as a function of elution volume for the rhodopsin–detergent complex (black circles). The calculated molar masses of protein and detergent in the rhodopsin–detergent complex are shown as red and green circles, respectively. The values obtained (35 kDa and 74 kDa) are close to the molar masses of rhodopsin (39 kDa; determined from the primary structure) and DDM micelles [74 kDa (49)].
Fig. 4.
Fig. 4.
Transducin binding to monomeric rhodopsin. (A) Superposition of SEC elution profiles: Gt holoprotein (Gαβγ) or rhodopsin (R; inactive ground state) alone (dashed lines) or as mixture (solid lines). (B) SEC elution profiles as in A obtained with R*. Detection occurred at the absorption maxima of protein (280 nm), R* (380 nm), and rhodopsin (500 nm). R*·Gt complex formation is indicated by a shift of the main elution peak. For this peak, a value of 3.6–3.8 was determined for the absorption ratio A280/A380 (black line), which is consistent with a 1:1 stoichiometry between R* and Gt in the R*·Gt complex (theoretical values are 3.56 for R*:Gt = 1:1 and 2.52 for R*:Gt = 2:1; see Materials and Methods). (C) SEC elution profile of R*/Gt mixture detected at 380 nm (absorption maximum of R*) and 253 nm (absorption maximum of GDP). The ratio between peak areas corresponding to R* and GDP, respectively, ranges from 3.0 to 3.2 for different runs (theoretical values are 3.07 for R*:Gt = 1:1 and 6.13 for R*:Gt = 2:1; see Materials and Methods).
Fig. 5.
Fig. 5.
G protein activation by monomeric rhodopsin. (A) Activation of Gt measured as tryptophan fluorescence increase attributable to GTPγS uptake [shown for 7.2 μM Gt, 1 nM R*, 200 μM GTPγS, and 0.008% (wt/vol) DDM at 20°C and pH 7.1]. Reactions were triggered by light activation (flash symbol) of rhodopsin. The arrow marks the point when additional R* was added to activate the whole Gt pool. (Left Inset) Same signal on expanded scale. Data points plotted in red were used for linear regression to determine reaction rate from initial slope of the fluorescence trace. See SI Fig. 6 for control experiments. (Right Inset) Reaction rates [nM activated Gt (Gt*) per second] as function of R* concentration [1 μM Gt, 0–3.0 nM R*, 0.01% (wt/vol) DDM]. (B) Gt activation rates plotted as a function of total Gt concentration [DDM concentration (wt/vol) as indicated]. Blue arrow indicates the data point (blue dot behind red dot) from the trace in A. Solid lines are best least-square fits of the data to a Michaelis–Menten type hyperbolic function, taking Gt subunit dissociation and Gt binding to detergent micelles into account. The numerical global fit yielded for all curves Vmax = 46 Gt*/R*·s, K1 = 0.46 μM (Gt subunit dissociation), and K2 = 1.76 μM (Gt micelle binding). Km values are 0.55 μM (0.006% DDM), 0.8 μM (0.008% DDM), and 2.3 μM (0.01% DDM). For recombinant rhodopsin and Gt, a similar rate profile was obtained [0.01% (wt/vol) DDM; data not shown]. (Inset) Gt activation rates (1 μM Gt) as a function of DDM detergent concentration.

References

    1. Foord SM, Bonner TI, Neubig RR, Rosser EM, Pin JP, Davenport AP, Spedding M, Harmar AJ. Pharmacol Rev. 2005;57:279–288. - PubMed
    1. Neves SR, Ram PT, Iyengar R. Science. 2002;296:1636–1639. - PubMed
    1. Liebman PA, Parker KR, Dratz EA. Annu Rev Physiol. 1987;49:765–791. - PubMed
    1. Fotiadis D, Liang Y, Filipek S, Saperstein DA, Engel A, Palczewski K. Nature. 2003;421:127–128. - PubMed
    1. Salom D, Lodowski DT, Stenkamp RE, Le Trong I, Golczak M, Jastrzebska B, Harris T, Ballesteros JA, Palczewski K. Proc Natl Acad Sci USA. 2006;103:16123–16128. - PMC - PubMed

Publication types