. 2007 Oct 1;110(7):2718-26.
doi: 10.1182/blood-2006-04-016535. Epub 2007 Jun 19.

Functional conservation of erythropoietin signaling in zebrafish

Affiliations

Functional conservation of erythropoietin signaling in zebrafish

Noëlle Paffett-Lugassy et al. Blood. .

Abstract

Erythropoietin (Epo) and its cognate receptor (EpoR) are required for maintaining adequate levels of circulating erythrocytes during embryogenesis and adulthood. Here, we report the functional characterization of the zebrafish epo and epor genes. The expression of epo and epor was evaluated by quantitative reverse transcriptase-polymerase chain reaction (RT-PCR) and whole-mount in situ hybridization, revealing marked parallels between zebrafish and mammalian gene expression patterns. Examination of the hypochromic mutant, weissherbst, and adult hypoxia-treated hearts indicate that zebrafish epo expression is induced by anemia and hypoxia. Overexpression of epo mRNA resulted in severe polycythemia, characterized by a striking increase in the number of cells expressing scl, c-myb, gata1, ikaros, epor, and betae1-globin, suggesting that both the erythroid progenitor and mature erythrocyte compartments respond to epo. Morpholino-mediated knockdown of the epor caused a slight decrease in primitive and complete block of definitive erythropoiesis. Abrogation of STAT5 blocked the erythropoietic expansion by epo mRNA, consistent with a requirement for STAT5 in epo signaling. Together, the characterization of zebrafish epo and epor demonstrates the conservation of an ancient program that ensures proper red blood cell numbers during normal homeostasis and under hypoxic conditions.


Figures

Figure 1
Figure 1
Alignment of vertebrate Epo and EpoR Sequences highlights conserved functional residues. Amino acid sequence comparison of Epo (A) and EpoR (B) from various vertebrate species (see “Results” for percentage of identity and similarity). (A) ● marks cysteines known to be required for the formation of disulphide bridges in mammals; the cysteines near the N- and C- termini are essential for stability and function. Double black circles indicate conserved N- and O-linked glycosylation sites; double gray circles indicate a predicted N-linked glycosylation site. (B) Conserved cysteines in the extracellular domain, required for ligand binding, are indicated by ○; the WSXWS domain, box 1, and box 2 are demarcated by black boxes; and the transmembrane domain (240-262) is marked by a thick black line. The 5 residues that comprise the hydrophobic patch are shaded in blue. Murine phosphotyrosines (with the exception of Y343) are boxed in black and labeled according to the mouse EpoR sequence. Murine Y343 is shaded in red within a red box, believed to be a consensus site for STAT5 binding; putative STAT5 binding sites in fish and frog are likewise marked. Identical amino acids are shaded in dark gray; similar residues, in light gray. The signal peptide is depicted above the mature EpoR.
Figure 2
Figure 2
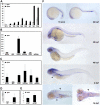
Conservation of zebrafish epo and epor expression. Detection of transcripts for epo and epor during ontogeny (A) and in select adult tissues (B,C) by quantitative RT-PCR. Expression of epo peaks slightly at 36 hpf, followed by an increase between 4 and 8 dpf. A total of 2 waves of epor expression are detected, 1 peak at 24 hpf, and another between 4 and 8 dpf. Expression of epo is induced in the hypochromic mutant weh, with respect to wild-type siblings (D) as well as in adult hypoxia-treated hearts, with respect to untreated controls (E). The average transcript abundance is represented by the bar graphs with standard deviations. (F) Spatiotemporal expression of epor was evaluated during embryonic development by whole-mount in situ hybridization. Transcripts were detected in the ICM from 18 somites until the onset of circulation at 24 hpf. Circulating erythroid cells maintain expression of epor until 32 hpf. At 4 dpf, epor is weakly expressed in the heart (*), and by 14 dpf, epor is localized to the heart (*) and is strongly expressed in the head kidney (▾). Lateral views, anterior to the left, a dorsal view of the 14-dpf embryo is also shown.
Figure 3
Figure 3
Overexpression of epo expands erythroid populations. Capped epo mRNA was injected into 1-cell–stage zebrafish embryos and evaluated by whole-mount in situ hybridization. A clear increase in (A) scl+ and (B) beta e1-globin+ cell number in response to exogenous epo is evident in circulation at all stages examined, as well as in the kidney primordium beginning at 4.5 dpf. The arrowhead marks the enlarged vein lumen caused by excess cells in circulation. Lateral views, anterior to the left. (C) An expansion of c-myb+ and epor+ cells can be observed in the kidney primordium (boxed) at 7 dpf, dorsal views, anterior to the left.
Figure 4
Figure 4
Loss of EpoR decreases primitive and blocks definitive erythropoiesis. beta e1-globin expression in (A) uninjected, (B) epor MO–injected, (C) epo mRNA–injected, and (D) epor MO:epo mRNA–injected embryos at 36 hpf, 2.5 dpf, and 4 dpf. Embryos injected with epor MO show a slight decrease in erythropoiesis beginning at 36 hpf, and by 4 dpf there is a complete absence of circulating erythrocytes. Injection of epo mRNA alone causes a progressive increase in the number of beta e1-globin+ cells in circulation throughout ontogeny. To demonstrate that epo and the epor are a functional ligand-receptor pair, epor MO was coinjected with epo mRNA. Loss of EpoR effectively blocks the expansion of erythrocytes by epo overexpression as shown by a decrease in beta e1-globin+ cell numbers. Lateral views, anterior to the left.
Figure 5
Figure 5
Abrogation of STAT5 blocks epo-induced polycythemia. o-dianisidine expression in (A) uninjected, (B) STAT5 MO–injected, (C) epo mRNA–injected, and (D) STAT5 MO:epo mRNA–injected embryos at 36 hpf, 2.5 dpf, and 4 dpf. Embryos injected with STAT5 MO show a slight decrease in erythropoiesis beginning at 36 hpf, and by 4 dpf there are very few erythrocytes in circulation. Injection of epo mRNA alone causes a progressive increase in the number of o-dianisidine+ cells in circulation. To demonstrate that STAT5 is required for signaling through the EpoR, STAT5 MO was coinjected with epo mRNA. Loss of STAT5 effectively blocks the expansion of erythrocytes by epo overexpression as shown by a decrease in o-dianisidine+ cell numbers. Lateral views, anterior to the left.

References

    1. Williams D, Bunn HF, Sieff C, Zon LI. Hematopoiesis. In: Handin RI, Lux SE, Stossel TP, editors. Blood. 2nd ed. Philadelphia, PA: Lippincott Williams and Wilkins; 2003. pp. 147–208.
    1. Fisher JW. Erythropoietin: physiology and pharmacology update. Exp Biol Med (Maywood) 2003;228:1–14. - PubMed
    1. Richmond TD, Chohan M, Barber DL. Turning cells red: signal transduction mediated by erythropoietin. Trends Cell Biol. 2005;15:146–155. - PubMed
    1. Gouilleux F, Pallard C, Dusanter-Fourt I, et al. Prolactin, growth hormone, erythropoietin and granulocyte-macrophage colony stimulating factor induce MGF-Stat5 DNA binding activity. EMBO J. 1995;14:2005–2013. - PMC - PubMed
    1. Koury MJ, Bondurant MC. Erythropoietin retards DNA breakdown and prevents programmed death in erythroid progenitor cells. Science. 1990;248:378–381. - PubMed

Publication types

MeSH terms