

Review
doi: 10.1093/jat/31.5.237.
Modern instrumental methods in forensic toxicology
Affiliations
- PMID: 17579968
- PMCID: PMC2745311
- DOI: 10.1093/jat/31.5.237
Item in Clipboard
Review
Modern instrumental methods in forensic toxicology
J Anal Toxicol.
2007 Jun.
Abstract
This article reviews modern analytical instrumentation in forensic toxicology for identification and quantification of drugs and toxins in biological fluids and tissues. A brief description of the theory and inherent strengths and limitations of each methodology is included. The focus is on new technologies that address current analytical limitations. A goal of this review is to encourage innovations to improve our technological capabilities and to encourage use of these analytical techniques in forensic toxicology practice.
Figures
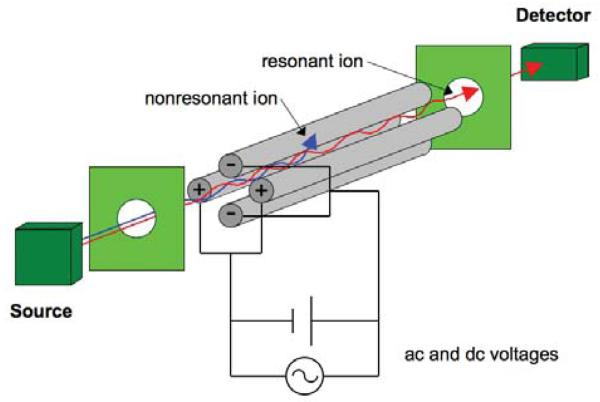
Schematic showing resonant ions of selected mass-to-charge ratios being sorted and detected in a quadrupole mass spectrometer (QMS). A constant DC to AC current ratio (AC current produces a radiofrequency field) selects the resonant ion. Source: http://www.chem.vt. edu/chem-ed/ac-meths.html .
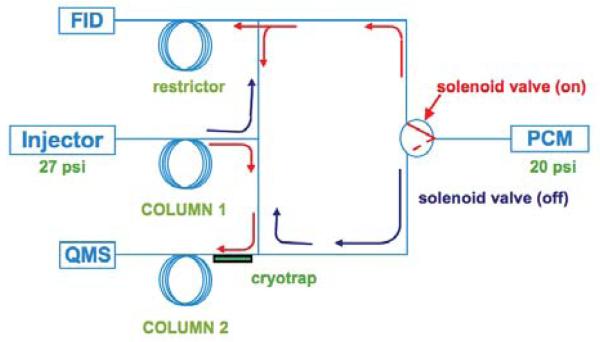
Schematic of a Deans Switch. When the solenoid switch is off, the pressure control module (PCM) directs flow from the first column to the flame ionization detector (FID; blue arrows). When the solenoid switch is turned on, the PCM directs flow from the first column onto the second column with detection by a quadrupole mass spectrometer (QMS; red arrows). Source: Agilent Technologies.
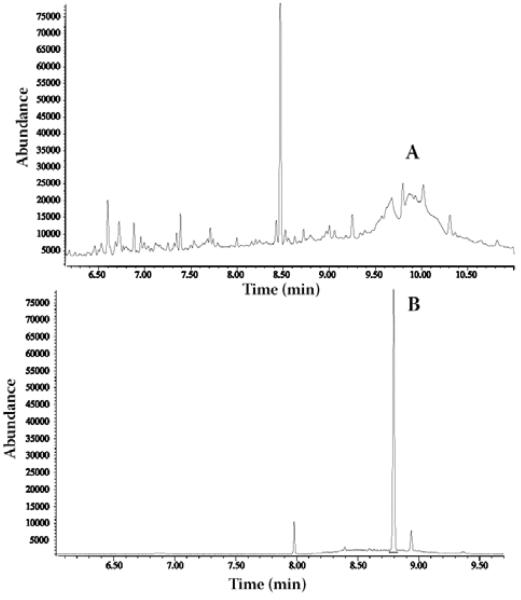
Selected ion chromatograms of 1 ng/mL of ?9-tetrahydrocannabinol in human plasma extracts produced without (peak A) and with (peak B) the Deans Switch (Agilent Technologies).
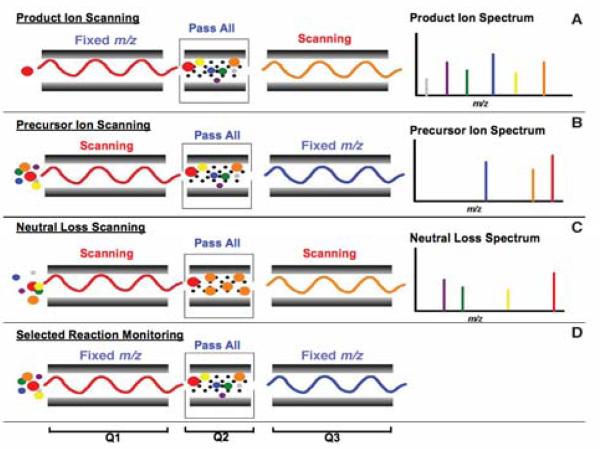
Schematic showing a tandem mass spectrometer (MS–MS). In a linear quadrupole instrument, Q1, Q2, and Q3 represent the three tandem quadrupoles. Four different operational configurations are shown: product ion scanning provides structural information (A); precursor ion scanning identifies all compounds producing specific fragments (B); neutral loss scanning screens for compounds producing neutral loss fragments (e.g., m/z 176 for glucuronide conjugates) (C); and selected reaction monitoring monitors targeted analytes and simultaneously monitors multiple transitions (D). Source: Thermo Fisher Scientific.
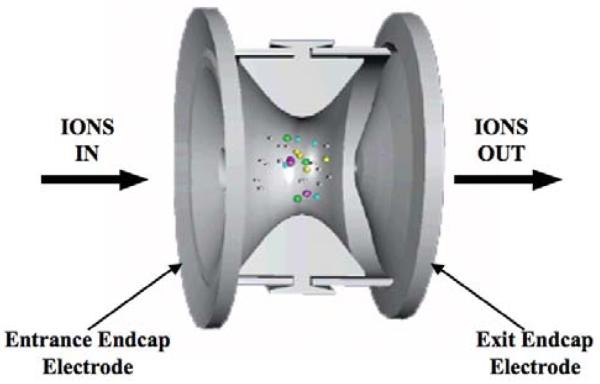
Schematic of ions sorted in an ion trap mass spectrometer (ITMS). Ions are accumulated, expelled on demand, and detected.
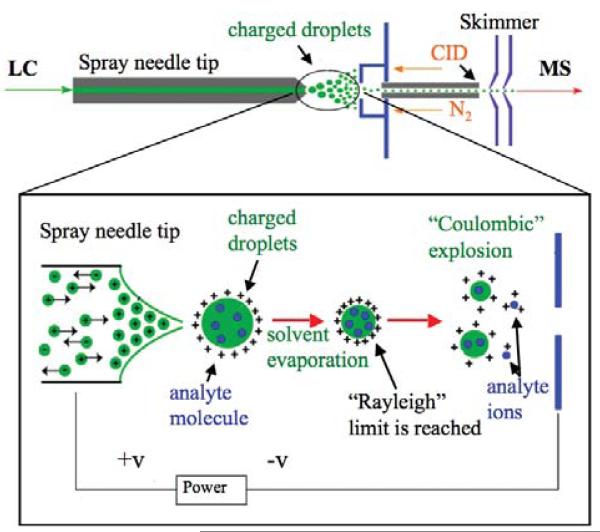
Schematic of an electrospray ionization (ESI) interface. Charged droplets explode during drying creating charged analytes that are filtered prior to entering a mass analyzer. Additional analyte molecules ionize from collision-induced dissociation (CID) with N2 molecules.

Schematic of an atmospheric pressure chemical ionization (APCI) interface. Solvent droplets are evaporated prior to the analyte contacting a corona discharge needle. The needle creates primary and secondary ions that transfer charge to analyte molecules during collisions. Additional fragmentation occurs from collision-induced dissociation (CID) with N2 molecules.
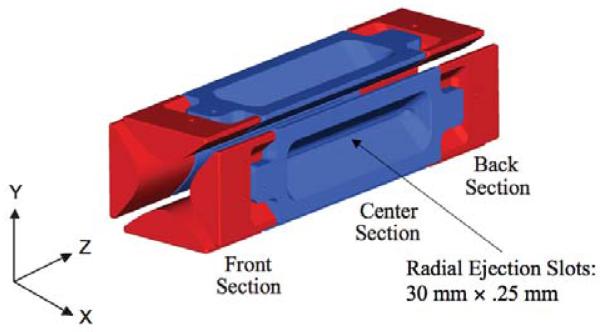
Schematic of a two-dimensional linear ion trap mass spectrometer (2D-ITMS). Ions traverse back and forth along the z-axis, trapped by a radial oscillating electric field (radio frequency). The kinetic energies of the ions are reduced (cooled) by interactions with gas molecules such as helium introduced separately. Ions are radially ejected when the trapping potential is lowered and strike an ion detector. Source: Thermo Fisher Scientific
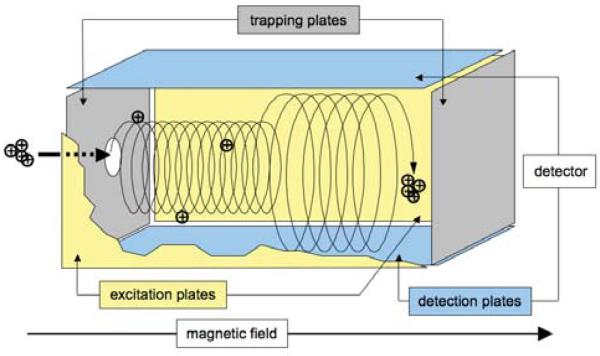
Schematic of a Penning trap, the central component of a Fourier transform ion cyclotron resonance mass spectrometer (FTMS). Ions enter the box, are trapped in the magnetic field, excited to larger, coherent orbital radii to facilitate detection, and the frequency of current induced in detection plates is measured and transformed to a mass-to-charge ratio.
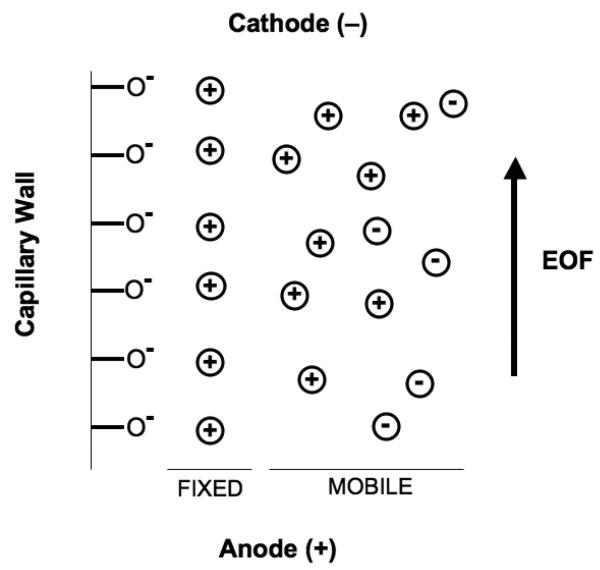
Schematic of a capillary electrophoresis instrument. Cations, anions and neutral molecules are propelled toward the cathode by electroosmotic flow (EOF) of the buffer. They are separated based on electrophoretic mobility and interaction with the adsorbent before entering a detector positioned at the cathode end of the capillary.
Similar articles
-
Hyphenated mass spectrometric techniques-indispensable tools in clinical and forensic toxicology and in doping control.J Mass Spectrom. 2006 Nov;41(11):1399-413. doi: 10.1002/jms.1112. J Mass Spectrom. 2006. PMID: 17051522 Review.
-
Mass Spectrometry for Research and Application in Therapeutic Drug Monitoring or Clinical and Forensic Toxicology.Ther Drug Monit. 2018 Aug;40(4):389-393. doi: 10.1097/FTD.0000000000000525. Ther Drug Monit. 2018. PMID: 29750739 Review.
-
Chiral drug analysis using mass spectrometric detection relevant to research and practice in clinical and forensic toxicology.J Chromatogr A. 2012 Dec 21;1269:122-35. doi: 10.1016/j.chroma.2012.07.045. Epub 2012 Jul 24. J Chromatogr A. 2012. PMID: 22858363
-
Perspectives of liquid chromatography coupled to low- and high-resolution mass spectrometry for screening, identification, and quantification of drugs in clinical and forensic toxicology.Ther Drug Monit. 2010 Jun;32(3):324-7. doi: 10.1097/FTD.0b013e3181dca295. Ther Drug Monit. 2010. PMID: 20418802 Review.
-
Current role of capillary electrophoretic/electrokinetic techniques in forensic toxicology.Anal Bioanal Chem. 2007 Aug;388(7):1359-64. doi: 10.1007/s00216-007-1381-1. Epub 2007 Jun 16. Anal Bioanal Chem. 2007. PMID: 17572886 Review.
Cited by
-
Curses or Cures: A Review of the Numerous Benefits Versus the Biosecurity Concerns of Conotoxin Research.Biomedicines. 2020 Jul 22;8(8):235. doi: 10.3390/biomedicines8080235. Biomedicines. 2020. PMID: 32708023 Free PMC article. Review.
-
LC-MS/MS-Based Method for the Multiplex Detection of 24 Fentanyl Analogues and Metabolites in Whole Blood at Sub ng mL-1 Concentrations.ACS Omega. 2018 Jan 31;3(1):514-523. doi: 10.1021/acsomega.7b01536. Epub 2018 Jan 17. ACS Omega. 2018. PMID: 29399650 Free PMC article.
-
Quantum Dots as Biosensors in the Determination of Biochemical Parameters in Xenobiotic Exposure and Toxins.Anal Sci. 2021 May 10;37(5):661-671. doi: 10.2116/analsci.20SCR03. Epub 2020 Dec 25. Anal Sci. 2021. PMID: 33390416 Review.
-
Mass Spectrometry Applications for Toxicology.EJIFCC. 2016 Dec 1;27(4):272-287. eCollection 2016 Dec. EJIFCC. 2016. PMID: 28149262 Free PMC article.
-
Positive toxicology and reactive serology in tissue donors: a retrospective study over a 3-year period.Cell Tissue Bank. 2020 Sep;21(3):427-431. doi: 10.1007/s10561-020-09827-2. Epub 2020 Apr 3. Cell Tissue Bank. 2020. PMID: 32246221 Free PMC article.
References
-
- Moffat AC, Osselton MD, Widdop B. Clarke's Analysis of Drugs and Poisons. 3rd ed Pharmaceutical Press; London, U.K.: 2004.
-
- Peters F, Maurer H. Bioanalytical method validation and its implications for forensic and clinical toxicology—a review. Accred. Qual. Assur. 2002;7:441–449.
-
- Armbruster DA, Tillman MD, Hubbs LM. Limit of detection (LQD)/limit of quantitation (LOQ): comparison of the empirical and the statistical methods exemplified with GC–MS assays of abused drugs. Clin. Chem. 1994;40:1233–1238. - PubMed
-
- Cody J. Mass spectrometry. In: Levine B, editor. Principles of Forensic Toxicology. AACC Press; Washington, D.C.: 2003. pp. 139–153.
-
- Nystrom I, Trygg T, Woxler P, Ahlner J, Kronstrand R. Quantitation of R-(−)- and S-(+)-amphetamine in hair and blood by gas chromatography–mass spectrometry: an application to compliance monitoring in adult-attention deficit hyperactivity disorder treatment. J. Anal. Toxicol. 2005;29:682–688. - PubMed
