. 2007 Aug 1;79(15):5620-32.
doi: 10.1021/ac0700833. Epub 2007 Jun 21.

High-speed data reduction, feature detection, and MS/MS spectrum quality assessment of shotgun proteomics data sets using high-resolution mass spectrometry

Affiliations

High-speed data reduction, feature detection, and MS/MS spectrum quality assessment of shotgun proteomics data sets using high-resolution mass spectrometry

Michael R Hoopmann et al. Anal Chem. .

Abstract

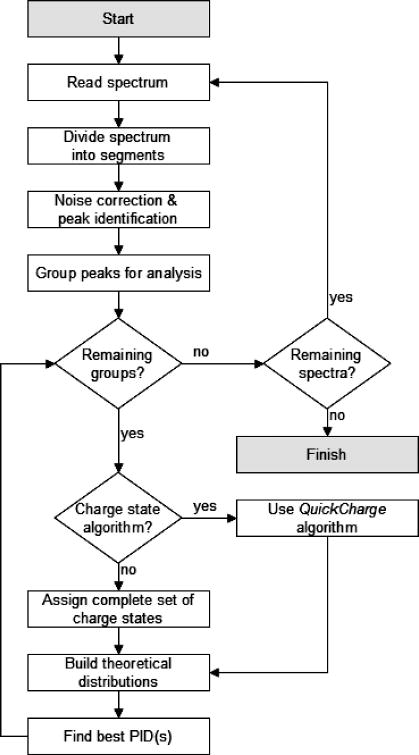
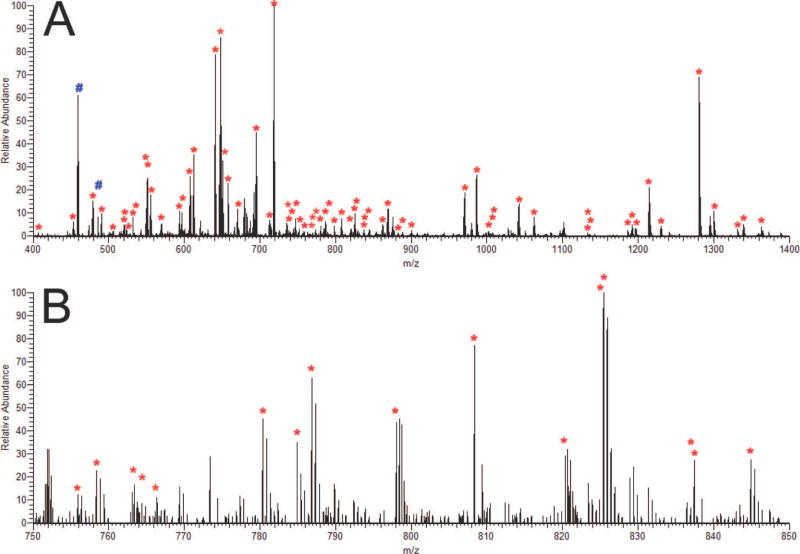
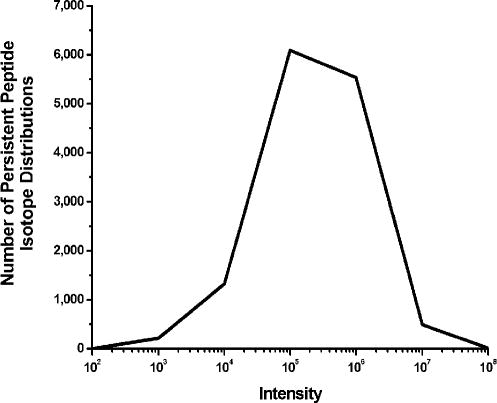
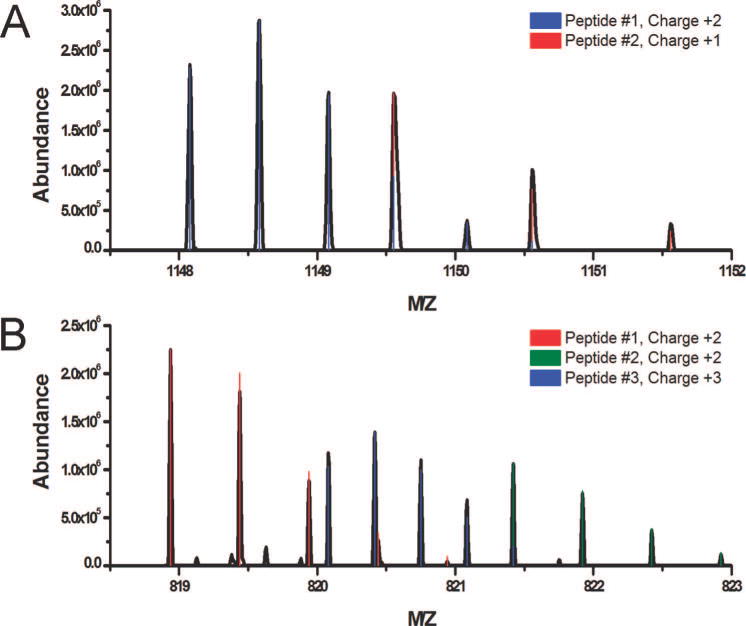
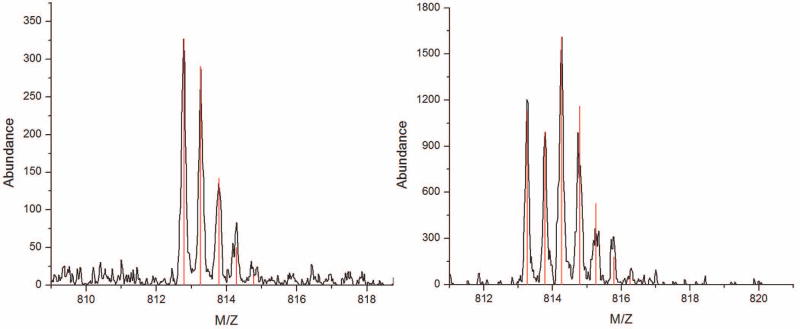
Advances in Fourier transform mass spectrometry have made the acquisition of high-resolution and accurate mass measurements routine on a chromatographic time scale. Here we report an algorithm, Hardklör, for the rapid and robust analysis of high-resolution mass spectra acquired in shotgun proteomics experiments. Our algorithm is demonstrated in the analysis of an Escherichia coli enriched membrane fraction. The mass spectrometry data of the respective peptides are acquired by microcapillary HPLC on an LTQ-orbitrap mass spectrometer with data-dependent acquisition of MS/MS spectra. Hardklör detects 211,272 total peptide isotope distributions over a 2-h analysis (75-min gradient) in only a small fraction of the time required to acquire the data. From these data there are 13,665 distinct, chromatographically persistent peptide isotope distributions. Hardklör is also used to assess the quality of the product ion spectra and finds that more than 11.2% of the MS/MS spectra are composed of fragment ions from multiple different molecular species. Additionally, a method is reported that enzymatically labels N-linked glycosylation sites on proteins, creating a unique isotope signature that can be detected with Hardklör. Using the protein invertase, Hardklör identifies 18O-labeled peptide isotope distributions of four glycosylation sites. The speed and robustness of the algorithm create a versatile tool that can be used in many different areas of mass spectrometry data analysis.


Figures

Figure 1
Figure 1
General approach for the analysis of μLC-MS data using Hardklör.
Figure 2
Figure 2
Illustration of base isotope peak alignment. Hardklör selects a peak (A) and constructs two averagine models at charge states of +1 (B) and +2 (C). The averagine models are aligned to the base isotope peak and a correlation score is computed (D and E). The predicted peptide isotope distribution that matches the measured isotope distribution with the highest similarity is accepted (E).
Figure 3
Figure 3
Combinatorial analysis of peptide isotope distributions with Hardklör. A list of averagine models is created for each peak in the observed distribution. Each averagine model is scored alone and in combination with the other models. The averagine model distribution or combination of distributions that has the closest similarity to the observed distribution is accepted.
Figure 4
Figure 4
Two-dimensional images of peptide isotope distributions before and after Hardklör analysis. (A) Images of the complexity of raw data from which peptide isotope distributions are derived. The red rectangle in the top image shows the region that is enlarged in the bottom image. (B) Hardklör has reduced the data to monoisotopic m/z values. The lengths of the lines represent persistence over multiple scans, one of the criteria for validating the isotope distributions, and the log normalized intensity is expressed using a heat map color scheme.
Figure 5
Figure 5
Example of Hardklor PIDs identified in a single scan. (A) Red stars (*) indicate the monoisotopic masses of PIDs with charge states of +1, +2, or +3. Blue pound signs (#) are some examples of visually obvious PIDs that were skipped because their charge states were outside the user-specified parameters (e.g. +4) (B) Enlarged region from 750 to 850 m/z.
Figure 6
Figure 6
Dynamic range of persistent peptide isotope distributions identified using Hardklör. Isotope distributions were automatically detected over an intensity range that spans ~103 to ~107 counts on the LTQ-Orbitrap.
Figure 7
Figure 7
Identification of overlapping peptide isotope distributions. (A) Deconvolution of two peptide isotope distributions of different charge states that share two peaks. (B) Deconvolution of three peptide isotope distributions over a 4 m/z spectral segment. Peptides were identified with different charge states, overlapping distributions (peptides #1 and #3), and shared peaks between distributions (peptides #2 and #3).
Figure 8
Figure 8
Example of isotope labeling a glycosylated peptide. (A) Isotope distribution for the non-glycosylated form of the invertase peptide, AEPILNISNAGPWSR. (B) Isotope distribution of the glycosylated form of the same peptide after digestion with PNGase-F in the presence of H218O at 50% APE. The monoisotopic mass (first peak) is slightly heavier because of the conversion of an asparagine to aspartic acid. The distinctive pattern of peak heights is a result of a single 18O present in 50% of the peptide molecules.

References

    1. Link AJ, Eng JK, Schieltz DM, Carmack E, Mize GJ, Morris DR, Garvik BM, Yates JR., III Nat Biotechnol. 1999;17:676–82. - PubMed
    1. Washburn MP, Wolters D, Yates JR., III Nat Biotechnol. 2001;19:242–47. - PubMed
    1. Syka JE, Marto JA, Bai DL, Horning S, Senko MW, Schwartz JC, Ueberheide B, Garcia B, Busby S, Muratore T, Shabanowitz J, Hunt DF. J Proteome Res. 2004;3:621–26. - PubMed
    1. Hardman M, Makarov AA. Anal Chem. 2003;75:1699–705. - PubMed
    1. Conrads TP, Anderson GA, Veenstra TD, Pasa-Tolic L, Smith RD. Anal Chem. 2000;72:3349–54. - PubMed

Publication types