. 2007 Jul 1;6(13):1613-20.
doi: 10.4161/cc.6.13.4357. Epub 2007 Apr 27.

Cytoplasmic volume condensation is an integral part of mitosis

Affiliations

Cytoplasmic volume condensation is an integral part of mitosis

Christa W Habela et al. Cell Cycle. .

Abstract

Cell growth and osmotic volume regulation are undoubtedly linked to the progression of the cell cycle as with each division, a newly generated cell must compensate for loss of half of its volume to its sister cell. The extent to which size influences cell cycle decisions, however, is controversial in mammalian cells. Further, a mechanism by which cells can monitor and therefore regulate their size has not been fully elucidated. Despite an ongoing debate, there have been few studies which directly address the question in single cell real-time experiments. In this study we used fluorescent time-lapse imaging to quantitatively assess volume in individual spontaneously dividing cells throughout the cell cycle. Together with biophysical studies, these establish that the efflux of salt and water brings about a condensation of cytoplasmic volume as glioma cells progress through mitosis. As cells undergo this pre-mitotic condensation (PMC) they approach a preferred cell volume preceding each division. This is functionally linked to chromatin condensation, suggesting that PMC plays an integral role in mitosis.


Figures

Figure 1
Figure 1
3D imaging of individual cells through the cell cycle demonstrates a decrease in cell volume and an approach to a common volume as they proceed to division (A) 3D projections created from image z-stacks are shown in the left panel. Images in the right panel are sections from the z-stack used to generate the corresponding projections to the left. Images are in chronological order from 1 to 5. (B) Volume measurements at specific time points relative to division are shown for 4 cells including the cell in A (triangle symbols). Time points 1 through 4 correspond to projections 1–4 in (A). For each cell, M phase (M) was set at t = 0 minutes with time prior to designated as negative time and time after division as positive time. (C) Gaussian fit to all time points prior to division for n = 14 cells from 3 separate experiments indicates a peak cell volume at −526 minutes (chi = 2.82055E6, r2 = 0.30974). (D) Volume at M phase, the last imaged time point prior to M phase and peak volume for each individual cell are compared. Repeated measures analysis of variance followed by a Tukey-Kramer Multiple comparisons test demonstrates a significant difference between all three time points. *** indicates a mean difference between Peak and Pre M of 2681.0 fL, p < 0.001. **indicates a mean difference between peak and M phase of 3955.4 fL, p < 0.001. * indicates a mean difference between pre M and M phase of 1274.3 fL, p < 0.05. (D) The standard deviation of cell volumes decreases linearly over time. Standard deviations are generated from data in (B) grouped by 60 minute intervals.
Figure 2
Figure 2
Plasma membrane thickening accompanies cytoplasmic contraction at M phase. (A) 3D renderings of an example field containing a contracted M phase cell (arrows) and several growth phase cells. Left panel depicts the cytoplasm alone (green). The right panel is the merged stacks of the cytoplasm (green) enveloped by the cell membrane (red). Arrowheads identify an M phase cell in the field. Each grid square is 10 μm2. (B) 2D sections of image stacks for bipolar and M phase cells distinguish between cytoplasm (top) and membrane (bottom) and demonstrate a thicker membrane in the M phase cells. Scale bar is 10 μm for both cells. (C) Membrane volume (Vmembrane) determined by reconstructing total cell volume in DiI images and subtracting cytoplasmic volume (V cytoplasm) determined from GFP images. Data represents paired data from an M phase and a bipolar cell from each field with n = 7 fields. Two-tailed value p = 0.0035.
Figure 3
Figure 3
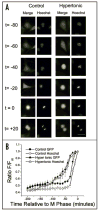
2D microscopy demonstrates that pre-mitotic contraction is rapid, of similar magnitude between cells and over consecutive divisions, and is correlated with cell cycle progression (A) Representative cell in 2D before (−60 minutes), during (0 minutes), and after (+60 minutes) M phase is shown. The increased intensity at 0 minutes in the GFP image indicates a decrease in cell volume. Scale bar is 20 μm. (B) F/Fm indicates average intensity within a specified region of interest normalized to last imaged time point prior to division (M phase) of Division 2. F/Fm traces are shown for 15 individual cells over 2 consecutive divisions. (C) Curve represents the averaged data from 69 untreated cells at the 2nd division observed within 48 hours. Error bars represent s.e.m., n = 3 separate experiments with N ≥ 20 cells each. T1/2 indicates the time at which half maximal intensity achieved. For the mean curve this value was 27.8 minutes prior to M phase. (D) Mean PMC curves for control and hypertonic wells from a representative experiment (control N = 45; hypertonic N = 12). (E) Cell cycle length is correlated with absolute T1/2 under both control (n = 69, r = 0.4351, p = 0.0002) and Hypertonic (n = 33, r = 0.6052, p = 0.0002) conditions.
Figure 4
Figure 4
Inhibition of Cl channels hinders PMC and impairs cell proliferation. (A) Mean control (N = 10) and NPPB (N = 10) traces of F/Fm in the 200 minutes preceding M phase for a representative 2D time-lapse experiment. (B) Individual control (filled symbols) and NPPB treated (open symbols) cell traces spanning two divisions each. Asterisks indicate time at which the NPPB treated cell (*) or Control cell (**) F/Fm ratio = 0.45, the starting ratio for PMC in controls. (C) Representative M phase (top) and bipolar (bottom) cells distinguished by cell body and nuclear morphology for electrophysiological recordings. (D) Representative voltage clamp traces from whole cell patch clamp recordings of an M phase cell in the presence of Paxilline (left) and after the application of 200μM NPPB (center). The subtracted NPPB sensitive current is shown to the right. Cells were stepped from a −40 mV holding potential to 0mV before making steps from −140 to 100mV in 20 mV increments. (E) Mean steady state current/voltage curves for M phase (n = 17) and bipolar cells (n = 11). (F) Mean current at +100 mV and −140 mV. Significant difference between M phase and M phase with NPPB (*), p = 0.0004 at +100 mV, p = 0.0021 at −140 mV; between M Phase and Bipolar (**), p = 0.0082 at +100 mV, = 0.0404 at −140 mV. (G) Mean NPPB sensitive current traces. Current is significantly larger at both +100 mV and −140 mV in the M phase cells (one tailed p value = 0.0474 and 0.0291 respectively). E–G error bars represent s.e.m.
Figure 5
Figure 5
Chromatin condensation is linked to pre-mitotic volume condensation. (A) Representative cells treated with control (320 mOsm) or hypertonic (500 mOsm) media. For each condition the left panel is a merge of the GFP and Hoechst image. The right panel shows Hoechst labeling alone. Scale bar is 40 μm for. (B) Mean traces of F/Fm values generated from GFP (closed symbols) or Hoechst (open symbols) under control and hypertonic conditions. Error bars represent s.e.m., n = 3 experiments, N ≥10.

Similar articles

Cited by

References

    1. Sveiczer A, Novak B, Mitchison JM. The size control of fission yeast revisited. J Cell Sci. 1996;109:2947–57. - PubMed
    1. Fantes PA, Nurse P. Control of the timing of cell division in fission yeast: Cell size mutants reveal a second control pathway. Exp Cell Res. 1978;115:317–29. - PubMed
    1. Rupes I. Checking cell size in yeast. Trends Genet. 2002;18:479–85. - PubMed
    1. Kellogg DR. Wee1-dependent mechanisms required for coordination of cell growth and cell division. J Cell Sci. 2003;116:24–90. - PubMed
    1. Cooper S. Control and maintenance of mammalian cell size. BMC Cell Biol. 2004;5:35. - PMC - PubMed

Publication types