. 2007 Jun 21;447(7147):1007-11.
doi: 10.1038/nature05883.

Prostaglandin E2 regulates vertebrate haematopoietic stem cell homeostasis

Affiliations

Prostaglandin E2 regulates vertebrate haematopoietic stem cell homeostasis

Trista E North et al. Nature. .

Abstract

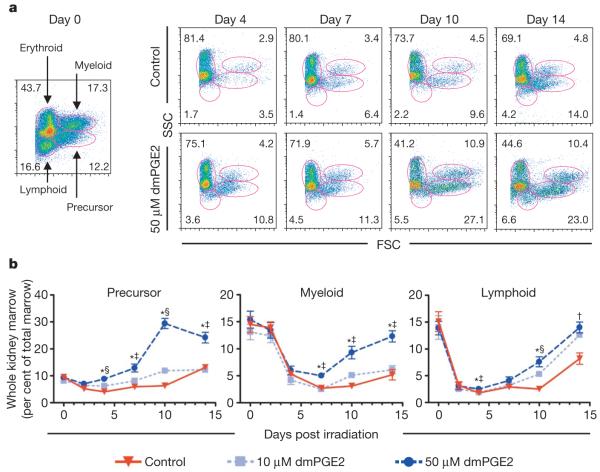
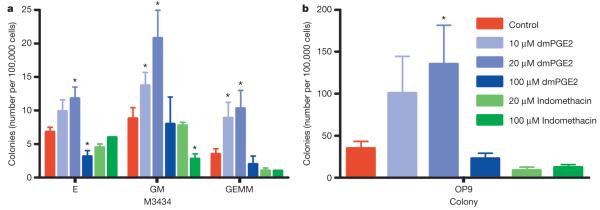
Haematopoietic stem cell (HSC) homeostasis is tightly controlled by growth factors, signalling molecules and transcription factors. Definitive HSCs derived during embryogenesis in the aorta-gonad-mesonephros region subsequently colonize fetal and adult haematopoietic organs. To identify new modulators of HSC formation and homeostasis, a panel of biologically active compounds was screened for effects on stem cell induction in the zebrafish aorta-gonad-mesonephros region. Here, we show that chemicals that enhance prostaglandin (PG) E2 synthesis increased HSC numbers, and those that block prostaglandin synthesis decreased stem cell numbers. The cyclooxygenases responsible for PGE2 synthesis were required for HSC formation. A stable derivative of PGE2 improved kidney marrow recovery following irradiation injury in the adult zebrafish. In murine embryonic stem cell differentiation assays, PGE2 caused amplification of multipotent progenitors. Furthermore, ex vivo exposure to stabilized PGE2 enhanced spleen colony forming units at day 12 post transplant and increased the frequency of long-term repopulating HSCs present in murine bone marrow after limiting dilution competitive transplantation. The conserved role for PGE2 in the regulation of vertebrate HSC homeostasis indicates that modulation of the prostaglandin pathway may facilitate expansion of HSC number for therapeutic purposes.


Figures

Figure 1
Figure 1. Prostaglandin agonists and antagonists alter runx1/cmyb expression without affecting vascular development
In situ hybridization for runx1/cmyb or flk1 at 36 h.p.f. Photomicrographs were taken with Nomarski optics at 10× (a-c, left panels) and 40× (a-c, right panels, and e-m) magnification. a-c, Representative examples of chemicals in the prostaglandin pathway discovered in the screen are shown; 10 μM linoleic acid increases, and 20 μM celecoxib reduces HSC numbers. runx1+/myb+ HSCs are indicated: endothelial cells (arrow); haematopoietic clusters (arrowhead). d, Quantitative PCR profile of endothelial and HSC-specific gene expression following exposure to long-acting dmPGE2 (10 μM, blue) or the nonspecific Cox inhibitor indomethacin (10 μM, green) versus control (red). Both treatments resulted in statistically significant differences compared with controls for each gene examined (ANOVA, *P < 0.05; mean, s.d. and n are listed in Supplementary Table 2). e-m, dmPGE2 and indomethacin exert opposing effects on runx1/cmyb expression by in situ hybridization (e, h, k); flk1 is used to assess the effects on vascular development (f, i, l). Confocal microscopy images of cmyb-gfp; lmo2-dsRed bigenic fish exposed to dmPGE2 and indomethacin showing an increase and decrease in HSC (yellow) number along the ventral wall (yellow arrowhead) of the aorta, respectively (g, j, m). Quantitative analysis of 10 embryos in each treatment group revealed significant differences in HSC numbers (Supplementary Fig. 1i).
Figure 2
Figure 2. Treatment with dmPGE2 enhances haematopoietic recovery in sublethally irradiated adult zebrafish
Zebrafish whole kidney marrow irradiation recovery experiments were performed. a, Representative FSC/SSC FACS profiles of haematopoietic cell lineages in the kidney marrow on days 0, 4, 7, 10 and 14 of irradiation recovery in DMSO and dmPGE2-treated (50 μM) zebrafish. b, Kinetics of kidney marrow reconstitution of precursor, lymphoid and myeloid cells in control and dmPGE2-treated fish. Statistically significant differences: †, 50 μM versus control; ‡, 50 μM versus 10 μM, and 50 μM versus control; and §, all variables significant (ANOVA, *P < 0.05; mean, s.d. and n listed in Supplementary Table 3).
Figure 3
Figure 3. dmPGE2 modulates colony number and haematopoietic differentiation in mouse embryonic stem cells
M3434 and OP9 embryonic stem cell colony-forming assays were performed; counts are per 100,000 cells plated. An asterisk (*) indicates a statistically significant difference (two-tailed t-test; mean, s.d. and n listed in Supplementary Table 4). a, Effect of increasing doses of dmPGE2 and inhibition of cyclooxygenase activity by indomethacin on haematopoietic differentiation in methylcellulose; numbers of definitive erythroid (E), mixed granulocyte/monocyte (GM), and multi-potent (GEMM) progenitor colonies are shown (10 μM dmPGE2: GM, P = 0.005; GEMM, P = 0.017; 20 μM dmPGE2: E, P = 0.04; GM, P = 0.007; GEMM, P = 0.016; 100 μM indomethacin: GM, P = 0.024). b, Effect of dmPGE2 and indomethacin on OP9 haematopoietic colony number (20 μM dmPGE2, P = 0.047).
Figure 4
Figure 4. Exposure of murine bone marrow to dmPGE2 increases the number of CFU-S and repopulating HSCs
An asterisk (*) indicates a statistically significant difference. a, b, Effect of ex vivo treatment of WBM (2 h on ice) with ethanol control (red) or dmPGE2 (1 μM per 106 cells) on CFU-S8 and CFU-S12 (60,000 cells per recipient; CFU-S12: two-tailed t-test, control (mean/s.d./n) = 5.78/2.73/9, dmPGE2 = 15.22/2.39/9, P < 0.0001). c, Effect on CFU-S12 following ex vivo treatment with indomethacin (1 μM per 106 cells) (100,000 cells/recipient; two-tailed t-test, control (mean/s.d./n) = 8.8/2.10/10, indomethacin = 2.5/1.43/10, P = 0.0001). d, CFU-S12 evaluation after treatment of cKit+Sca1+Lineage- stem cells with dmPGE2 or ethanol control (two-tailed t-test, 100 cells: control (mean/s.d./n) = 3/1.63/4, dmPGE2 = 6.2/1.3/5, P = 0.013; 300 cells: control (mean/s.d./n) = 5/1.22/5, dmPGE2 = 11/1.87/5, P = 0.0003). e, f, Limiting dilution competitive repopulation assay. The number of negative recipients as determined by FACS analysis (e) in relation to the total number of cells transplanted for control or dmPGE2-treated cell samples is shown at 12 weeks. P0 = 67,884 (control) and 16,970 (dmPGE2 treated). The frequency of engraftment (f) at 6, 12, and 24 weeks post transplantation in recipients of ethanol- versus dmPGE2-treated WBM calculated by Poisson statistics (ANOVA, n = 10 per variable; 6 wks, P = 0.005; 12 wks, P = 0.002; 24 wks, P = 0.05); the number of recipients surviving to analysis at each time point is shown in Supplementary Tables 7-9.

References

    1. Dzierzak E. The emergence of definitive hematopoietic stem cells in the mammal. Curr. Opin. Hematol. 2005;12:197–202. - PubMed
    1. Galloway JL, Zon LI. Ontogeny of hematopoiesis: examining the emergence of hematopoietic cells in the vertebrate embryo. Curr. Top. Dev. Biol. 2003;53:139–158. - PubMed
    1. North TE, et al. Runx1 expression marks long-term repopulating hematopoietic stem cells in the midgestation mouse embryo. Immunity. 2002;16:661–672. - PubMed
    1. Mukouyama Y, et al. Hematopoietic cells in cultures of the murine embryonic aorta-gonad-mesonephros region are induced by c-Myb. Curr. Biol. 1999;9:833–836. - PubMed
    1. Kalev-Zylinska ML, et al. Runx1 is required for zebrafish blood and vessel development and expression of a human RUNX1-CBF2T1 transgene advances a model for studies of leukemogenesis. Development. 2002;129:2015–2030. - PubMed

Publication types

MeSH terms