

doi: 10.1016/j.jchromb.2007.05.034.
Epub 2007 Jun 2.
Assessing biomarkers of oxidative stress: analysis of guanosine and oxidized guanosine nucleotide triphosphates by high performance liquid chromatography with electrochemical detection
Affiliations
- PMID: 17581804
- PMCID: PMC2072907
- DOI: 10.1016/j.jchromb.2007.05.034
Item in Clipboard
Assessing biomarkers of oxidative stress: analysis of guanosine and oxidized guanosine nucleotide triphosphates by high performance liquid chromatography with electrochemical detection
J Chromatogr B Analyt Technol Biomed Life Sci.
.
Abstract
Oxidation of the guanosine moiety in DNA has become a hallmark biomarker in assessing oxidative stress. The oxidation of guanosine in the nucleotide triphosphate pool has been overlooked due to the lack of a reliable methodology. This method describes a sample processing and high performance liquid chromatography with electrochemical detection protocol for the analysis of the cellular pool of guanosine triphosphates and oxidized guanosine triphosphates. Validation of this method is demonstrated along with evaluation of these analytes in control and oxidizing conditions in vitro and in HEK 293T cells. Oxidation of this triphosphate pool occurred independently of oxidation to DNA.
Figures
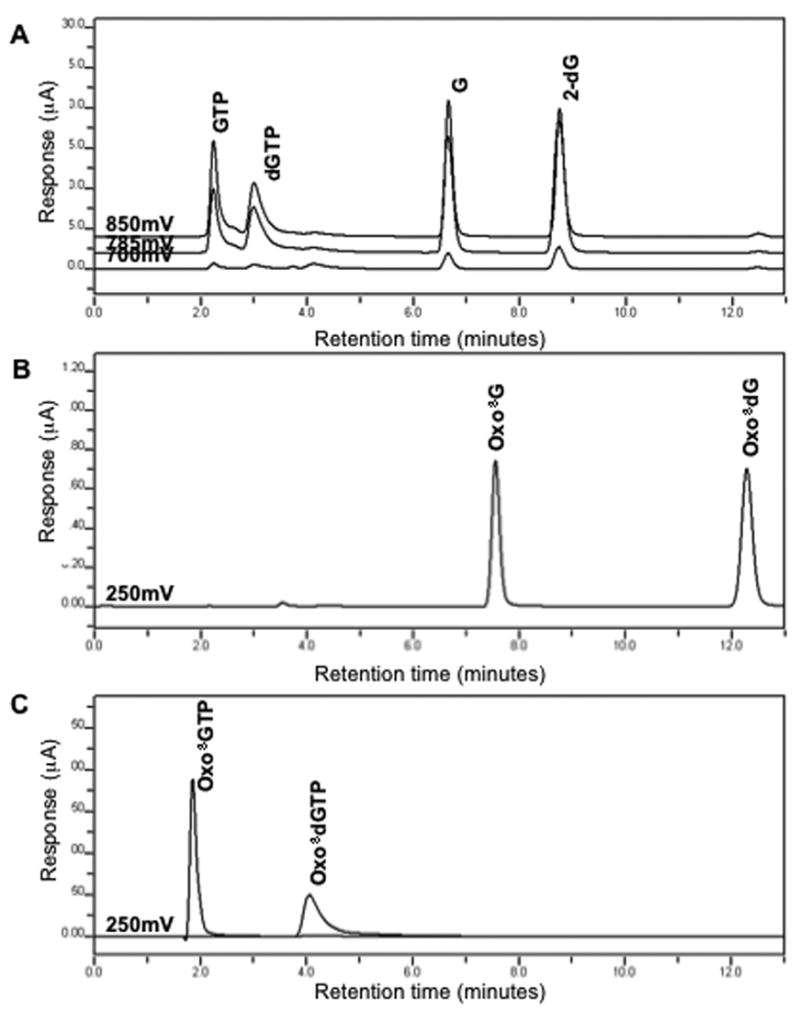
Chromatographic profiles for a standard containing GTP, dGTP, G, and 2-dG (A) detected in channels set at 700, 785, and 850 mV, a standard containing oxo8G and oxo8dG detected with a channel set at 250 mV (B), and standards of oxo8GTP and oxo8dGTP detected at 250 mV (C).

Solid lines are calibration curves built with known amounts of 2-dG(A), G (B), oxo8dG (C), and oxo8G (D). Dashed lines are calibration curves built with equivalent amounts of standards containing dGTP (A), GTP (B), oxo8dGTP (C), and oxo8GTP (D) after alkaline phosphatase treatment. (n = 2).
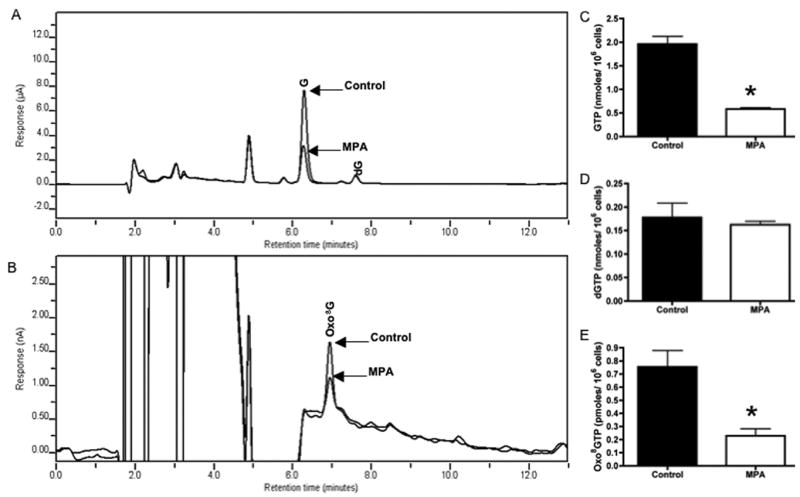
Typical chromatograhic profiles of cytosolic cellular extracts, after treatment with alkaline phosphatase, obtained from HEK 293T cells in control or MPA-exposed populations (2μM, 1 hour). Typical retention times for G and 2-dG generated are presented in 3A, and that for oxo8G in 3Bm (chromatograms reflect a 3D shift for display purposes). Although channels 700, 785, and 850 mV were used for quantitation of GTP and dGTP, only channel 785 mV shown in figure. Bar graphs show cellular levels of GTP (C), dGTP (D), and oxo8GTP (E) in control (black bar) and MPA treated (white bar) cells. Values expressed as nanomoles (dGTP and GTP) or picomoles (oxo8GTP) per 106 cells. Data expressed as the mean ± SEM (n =3–4, * p < 0.05).

Chromatograhic profiles of dephosphorylated GTP (A) and oxo8GTP (B) after GTP exposure to control (1mM L-ascorbic acid) or oxidizing conditions (1mM L-ascorbic acid and 10μM cupric sulfate). Bar graph shows nanomoles of GTP (C) and picomoles oxo8GTP (D) in GTP samples exposed to control (black bar) or oxidizing conditions (white bar). Data expressed as the mean ± SEM (n =6–9, * p < 0.05).
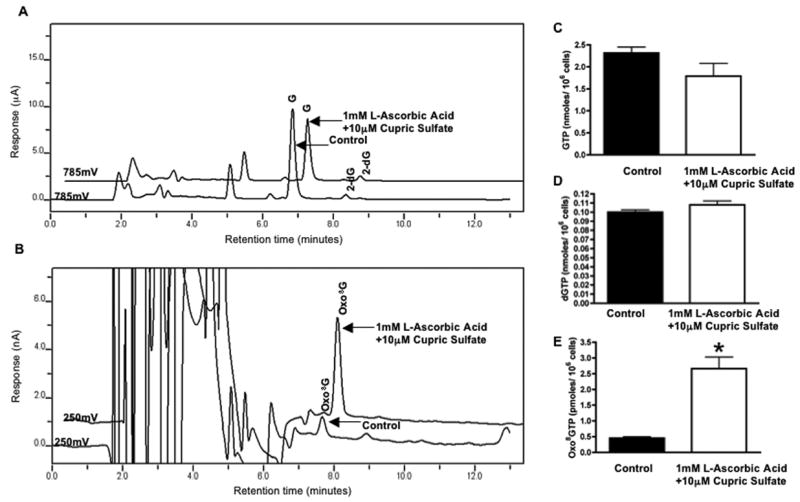
Chromatograhic profiles of alkaline phosphatase treated cytosolic cellular extracts obtained from HEK 293T cells in control (1mM L-ascorbic acid) or oxidizing (1mM L-ascorbic acid, 10 μM cupric sulfate) conditions. Typical elution profiles for the generated G and 2-dG (A) and typical elution profile for the oxo8G generated (B). Bar graphs represent cellular levels of GTP (C), dGTP (D), and oxo8GTP (E) in control (black bar and treated cell populations (white bar). Data expressed as levels per 106 cells. Data expressed as the mean ± SEM (n =3, * p < 0.05).
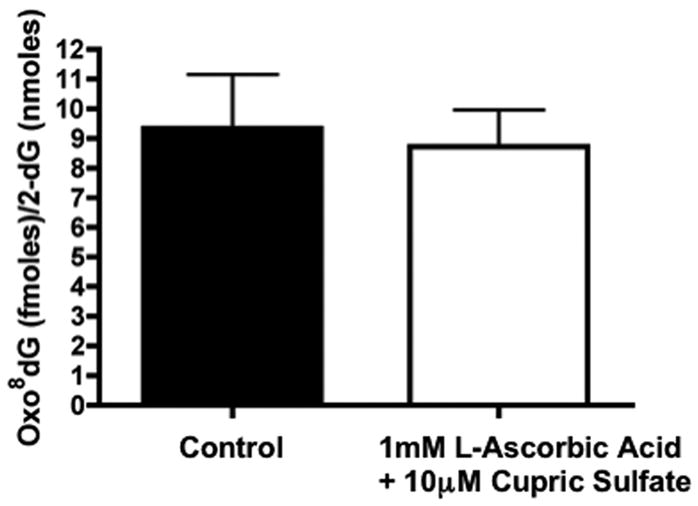
Levels of oxo8dG, as compared to the levels of 2-dG, in DNA isolated from HEK 293T cells exposed to 1mM L-ascorbic acid (control, black bar) or 1mM L-ascorbic acid, 10 μM cupric sulfate (oxidizing conditions, white bar). Data expressed femtomoles of oxo8dG per nanomoles of 2-dG in DNA. Bars represent mean ± SEM (n =4).
References
-
- Halliwell B, Gutteridge JM. Arch Biochem Biophys. 1986;246:501. - PubMed
-
- Alam ZI, Jenner A, Daniel SE, Lees AJ, Cairns N, Marsden CD, Jenner P, Halliwell B. J Neurochem. 1997;69:1196. - PubMed
-
- Sanchez-Ramos J, Eva Overvik, B Ames. Neurodegeneration. 1994;3:197.
-
- Hollstein M, Sidransky D, Vogelstein B, Harris CC. Science. 1991;253:49. - PubMed
Publication types
MeSH terms
Substances
Grants and funding
LinkOut - more resources
Full Text Sources
Miscellaneous
