. 2007 Aug 17;282(33):24099-108.
doi: 10.1074/jbc.M701191200. Epub 2007 Jun 20.

A family of G protein βγ subunits translocate reversibly from the plasma membrane to endomembranes on receptor activation

Affiliations

A family of G protein βγ subunits translocate reversibly from the plasma membrane to endomembranes on receptor activation

Deepak Kumar Saini et al. J Biol Chem. .

Abstract

The present model of G protein activation by G protein-coupled receptors exclusively localizes their activation and function to the plasma membrane (PM). Observation of the spatiotemporal response of G protein subunits in a living cell to receptor activation showed that 6 of the 12 members of the G protein gamma subunit family translocate specifically from the PM to endomembranes. The gamma subunits translocate as betagamma complexes, whereas the alpha subunit is retained on the PM. Depending on the gamma subunit, translocation occurs predominantly to the Golgi complex or the endoplasmic reticulum. The rate of translocation also varies with the gamma subunit type. Different gamma subunits, thus, confer distinct spatiotemporal properties to translocation. A striking relationship exists between the amino acid sequences of various gamma subunits and their translocation properties. gamma subunits with similar translocation properties are more closely related to each other. Consistent with this relationship, introducing residues conserved in translocating subunits into a non-translocating subunit results in a gain of function. Inhibitors of vesicle-mediated trafficking and palmitoylation suggest that translocation is diffusion-mediated and controlled by acylation similar to the shuttling of G protein subunits (Chisari, M., Saini, D. K., Kalyanaraman, V., and Gautam, N. (2007) J. Biol. Chem. 282, 24092-24098). These results suggest that the continual testing of cytosolic surfaces of cell membranes by G protein subunits facilitates an activated cell surface receptor to direct potentially active G protein betagamma subunits to intracellular membranes.


Figures
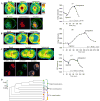
FIGURE 1
FIGURE 1. Receptor-mediated translocation of G protein βγ complexes
M2-CHO cells transfected with αo, mCherry-β1, and YFP-tagged γ subunits as indicated were used. Images of YFP-γ subunits from transfected cells were captured every 10 or 20 s. Cells were exposed to 100 μm carbachol (Agonist) followed by 100 μm atropine (Antagonist) at the indicated time points. YFP intensity changes over time in Golgi or ER were plotted. Plots are of similar scales for comparison. Representative images are shown. Mean pixel intensity measurements for plots were from regions enclosed in black circles or squares, indicated in agonist-treated images. The decrease in fluorescence intensity over time is due to photobleaching. A, translocation of YFP-γ9 to Golgi (n > 20). Shown are confocal images of M2-CHO cells expressing αo, β1, YFP-γ9, and galactosyl transferase (GalT)-DsRed monomer (DsRed) after exposure to carbachol (n = 8). B, translocation of YFP-γ10 to the Golgi (n = 10). C, translocation of YFP-γ13 to ER (n > 20). Cells were treated with brefeldin A to eliminate the Golgi. Shown are confocal images of carbachol-exposed M2-CHO cells expressing αo, β1, YFP-γ13, and KDEL-DsRed, an ER marker (n = 10). Note that the PM distribution of γ13 compared with the ER marker is visible (green peripheral signal) in the overlay. D, cladogram shows the relationship between primary structures and translocation properties. The predominant endomembrane targets after translocation of γ subunit types are shown.
FIGURE 2
FIGURE 2. Translocation of γ subunit chimeras and mutants
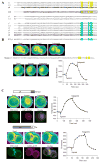
A, the γ subunit family is divided as in the cladogram (Fig. 1D) into four groups based on the spatiotemporal properties of translocation. Amino acids mostly conserved within the C-terminal domain of the subunits are highlighted. B, translocation of a wild type and mutant γ3 subunit. Mutated residues are highlighted in both the wild type and mutant γ3. Transfected cells were assayed for translocation, and the data are plotted as described in Fig. 1. Shown are representative data (n ≥ 4). C, translocation of chimeric molecules of γ9 and γ13. Transfected cells were assayed for translocation, and the data are plotted as described in Fig. 1. The images of cells after translocation were overlaid with corresponding images of the same cells expressing Golgi or ER marker. Representative data are shown (n ≥ 5).
FIGURE 3
FIGURE 3. Effect of different α subunits on translocation of different γ subunits
Plots of emission intensities from the intracellular membranes (Golgi or ER) as a function of time in CHO cells expressing M3 receptor, αq, mCh-β1, and YFP-tagged γ subunits as indicated to quantitate potential translocation. Transfected cells were assayed for translocation, and the data are plotted as described in Fig. 1. Representative data are shown (n ≥ 4). A, translocation plot for YFP-γ9 subunit. B, translocation plot for YFP-γ13 subunit. C, translocation plot for YFP-γ10 subunit.
FIGURE 4
FIGURE 4. Effect of different receptors on translocation of γ subunits
Plots of emission intensities from the intracellular membranes (Golgi) as a function of time in CHO cells expressing different receptors as indicated to quantitate potential translocation of YFP-tagged γ subunits as indicated. Transfected cells were assayed for translocation, and the data are plotted as described in Fig. 1. Representative data are shown (n ≥ 4). A, translocation plots in CHO cells transfected with α2 adrenergic receptor (α2AR) tagged with CFP, αo, mCh-β1 and YFP-γ9 subunits. Transfected cells were exposed to 100 μm norepinephrine, and images were captured at the indicated time points followed by exposure to 20 μm yohimbine. B, translocation plots in CHO cells transfected with D2 dopamine receptor tagged with CFP, βo, mCh-β1 and YFP-γ13 subunits. Transfected cells were exposed to 10 μm quinpirole, and images were captured at indicated time points followed by exposure to 100 nm sulpiride. C, translocation plots in CHO cells transfected with α2 adrenergic receptor tagged with CFP, αo, mCh-β1 and YFP-γ10 subunits. Transfected cells were exposed to 100 μm norepinephrine, and images were captured at the indicated time points followed by exposure to 20 μm yohimbine.
FIGURE 5
FIGURE 5. Translocation of different γ subunits in different cell lines
Plots of emission intensities from the intracellular membranes (Golgi or ER) as a function of time. Different cell lines (as indicated) were transfected with M3 receptor, αq, β1, and YFP-tagged γsubunits as indicated to quantitate potential translocation. Transfected cells were assayed for translocation, and the data are plotted as described in Fig. 1. Representative data are shown (n ≥ 4). A, translocation plots of γ13 in HeLa cells transfected with M3 receptor, αq, mCh-β1, and YFP-γ13 subunits. B, translocation plots of γ11 in J774 cells transfected with M2 receptor, αo, mCh-β1, and YFP-γ11 subunits. C, translocation plots of γ13 in HeLa cells transfected with αo, mCh-β1, and YFP-γ13 subunits stimulated through the endogenous α2 adrenergic receptor (α2AR).
FIGURE 6
FIGURE 6. Images of translocation of YFP-γ11 in the presence and absence of 2BP
M2-CHO cells stably expressing αo-CFP, β1, and YFP-γ11 were treated with 2BP, and translocation was assayed as in Fig. 1 under “Materials and Methods” (n ≥ 10).

References

    1. Gilman AG. Annu Rev Biochem. 1987;56:615–649. - PubMed
    1. Simon MI, Strathmann MP, Gautam N. Science. 1991;252:802–808. - PubMed
    1. Neves SR, Ram PT, Iyengar R. Science. 2002;296:1636–1639. - PubMed
    1. Cabrera-Vera TM, Vanhauwe J, Thomas TO, Medkova M, Preininger A, Mazzoni MR, Hamm HE. Endocr Rev. 2003;24:765–781. - PubMed
    1. Kisselev O, Gautam N. J Biol Chem. 1993;268:24519–24522. - PubMed

Publication types

MeSH terms

Substances