Comparative Study
. 2007 Jun 20;27(25):6712-22.
doi: 10.1523/JNEUROSCI.1329-07.2007.

Schwann cell-derived factors modulate synaptic activities at developing neuromuscular synapses

Affiliations
Comparative Study

Schwann cell-derived factors modulate synaptic activities at developing neuromuscular synapses

Guan Cao et al. J Neurosci. .

Abstract

Glial cells are active participants in the function, formation, and maintenance of the chemical synapse. To investigate the molecular basis of neuron-glia interactions at the peripheral synapse, we examined whether and how Schwann cell-derived factors modulate synaptic function at developing neuromuscular junctions (NMJs). Schwann cell-conditioned medium (SC-CM) from Xenopus Schwann cell cultures was collected and applied to Xenopus nerve-muscle cocultures. We found that SC-CM increased the frequency of spontaneous synaptic currents (SSCs) within 3-15 min by an average of approximately 150-fold at developing neuromuscular synapses. The increase in SSC frequency by SC-CM is a presynaptic effect independent of neuronal excitability and requires the influx of Ca2+. In contrast to its potentiating effect on spontaneous transmitter release, SC-CM suppressed the evoked transmitter release. The SC-CM effect required the presence of motoneuron soma but not protein synthesis. Using molecular weight cutoff filters and dialysis membranes, we found that the molecular weight of functional factor(s) in SC-CM was within 500 and 5000 Da. The SC-CM effect was not attributable to currently known factors that modulate synaptic efficacy, including neurotrophins, glutamate, and ATP. SC-CM also enhanced spontaneous synaptic release at developing NMJs in Xenopus tadpoles in situ. Our results suggest that Schwann cells release small molecules that enhance spontaneous synaptic activities acutely and potently at developing neuromuscular synapses, and the glial cell-enhanced spontaneous neurotransmission may contribute to synaptogenesis.


Figures
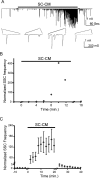
Figure 1.
Figure 1.
SC-CM increases the frequency of spontaneous synaptic release reversibly. A, An example of recordings depicting membrane currents recorded from a singly innervated myocyte using perforated-patch whole-cell recording method. SSCs are represented by downward deflections. The NCM is replaced with SC-CM during the period indicated by the horizontal bar. Samples of SSCs are shown below at higher time resolution. The SSC frequency began to increase ∼6 min after SC-CM was applied in this example and was restored after SC-CM was replaced with NCM. The line break (//) indicates an ∼2 min break of changing solution by perfusion in this and the following figures. B, The SSC frequency in A was quantified and normalized with the average SSC frequency in NCM. Each data point represents the SSC frequency during a 2 min period. SC-CM increased the SSC frequency gradually, and the increase was reversed after washout of SC-CM. Note that the SSC frequency surged initially to ∼400-fold and then dropped by ∼50% in this example. The initial surge of SSC frequency during application of SC-CM has also been seen in other examples. C, Summary of 22 experiments shows the changes in SSC frequency (mean ± SE) after the treatment of SC-CM. The recordings started with NCM as the bath solution; the horizontal bar indicates the period during which SC-CM was applied.
Figure 2.
Figure 2.
The potentiation of SSC frequency by SC-CM is a presynaptic effect and is independent of motoneuron action potentials. A, Histograms of amplitude distribution of SSCs recorded in NCM (filled bars) for 10 min immediately before and 20 min after SC-CM (open bars) treatment. The normalized events were averaged from eight myocytes. B, The cumulative probability of the distributions of SSC amplitudes before (triangles) and after (squares) the treatment of SC-CM. The bin size is 20 pA. Cumulative probability refers to the probability of collecting events, whose amplitudes were equal or less than the given amplitude. The curve represents the average distribution of SSC amplitudes from eight NMJs. The distribution of SSC amplitudes after the application of SC-CM was not significantly different from that before the application of SC-CM (p > 0.1, Kolmogorov–Smirnov test). C, Summary data showing that the SC-CM effect is independent of neuronal action potentials (n = 4). TTX had no effect on the high-frequency spontaneous synaptic release induced by SC-CM. Each data point represents normalized mean ± SEM SSC frequency.
Figure 3.
Figure 3.
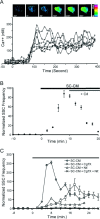
The Ca2+ involvement in the SC-CM effect. A, The intracellular Ca2+ concentration in motoneuron soma was increased by SC-CM. Top, An example showing a series of Ca2+ images taken sequentially as the SC-CM was applied at the time of 0 s. Bottom, Seven experiments showing the cytoplasmic Ca2+ concentration change inside the neuronal soma with time. The SC-CM was applied at 0 s in all experiments. B, Summary data for the change in SSC frequency after the application of SC-CM, followed by the addition of Cd2+ (0.2 mm) (n = 9). The application of SC-CM and Cd2+ (0.2 mm) is marked by the black and gray horizontal bars, respectively. The increase in SSC frequency (mean ± SEM) by SC-CM was completely suppressed after the blockade of extracellular Ca2+ influx by Cd2+. Each data point represents normalized mean ± SEM SSC frequency. C, The SSC frequency changes induced by SC-CM in the presence of different types of Ca2+ channel blockers (n = 4 for each group of experiments). SC-CM was applied to neuromuscular synapses by itself (diamonds) or combined with N-type Ca2+ channel blocker CgTX (1 μm) (squares), the L-type Ca2+ channel blocker nifedipine (10 μm) (Nif; triangles), or both (×). At 20 min after treatments, the average SSC frequencies in SC-CM alone, SC-CM plus CgTX, SC-CM plus nifedipine, and SC-CM plus CgTX plus nifedipine were 42.42-fold, 48.04-fold, 10.47-fold, and 1.18-fold of that in NCM, respectively. The SSC frequency (mean ± SEM) in SC-CM is significantly higher than that in SC-CM plus nifedipine, which in turn is significantly higher than that in NCM (p < 0.05, t test). The horizontal bar indicates the period during which SC-CM with or without Ca2+ channel blockers was applied. Each data point represents normalized mean ± SEM SSC frequency.
Figure 4.
Figure 4.
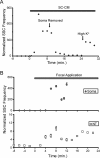
The increase in SSC frequency by SC-CM requires the signal from the soma. A, An example showed that the potentiation of spontaneous synaptic release by SC-CM was blocked after the motoneuron soma was removed. In contrast, high K+ increased the SSC frequency despite the removal of the motoneuron soma, which confirmed the vitality of the synapse. The duration of SC-CM application is marked with the horizontal bar. The removal of the motoneuron soma and the addition of high concentration of K+ are marked by arrows. B, Focal application of SC-CM with a pair of electrode pipettes. SC-CM, mixed with trypan blue as an indicator for the flow, was locally applied by perfusion toward the motoneuron soma (diamonds; n = 5) or the nerve–muscle contact (squares; n = 4). When SC-CM was focally applied to the soma, the SSC frequency greatly potentiated, up to 400-fold. In contrast, only an approximately eightfold increase was seen when SC-CM focally applied to the nerve terminal region (NT). The SSC frequency was normalized with the average SSC frequency before the SC-CM application. Each data point represents normalized mean ± SEM SSC frequency.
Figure 5.
Figure 5.
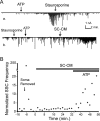
The SC-CM effect is not mediated by ATP. A, The SC-CM effect has different signal pathways from ATP. a, ATP (0.3 mm) increased the SSC frequency, which was blocked by a PKC inhibitor, staurosporine (0.5 μm). b, With the addition of staurosporine in the bath, ATP could not increase the SSC frequency, but SC-CM did. The line breaker (//) marks a 20 min interval. B, The potentiation of spontaneous synaptic release by ATP does not require the motoneuron soma. The removal of motoneuron soma is indicated by an arrow, the application of SC-CM is marked by a solid horizontal bar, and the addition of ATP is represented by a gray horizontal bar. Right after the soma removal, the SSC frequency increased instantly to >200-fold of the control level attributable to the massive influx of bath Ca2+ into the axon from the trunk opening, as shown previously by Stoop and Poo (1995). After the removal of excessive internal Ca2+ at the nerve terminal, the SSC frequency returned to the control level, and the application of SC-CM could not increase SSC frequency. However, ATP could still increase the frequency of spontaneous release after the motoneuron soma was removed.
Figure 6.
Figure 6.
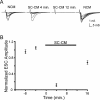
SC-CM reversibly inhibits evoked synaptic transmission. A, An example showing that SC-CM inhibits ESCs. The motoneuron was stimulated at the soma with an extracellular microelectrode at the frequency of 0.05 Hz. Samples of ESCs were recorded at different times when the neuromuscular synapse was in NCM, then SC-CM, and then NCM again. B, Summary of the changes of mean ESC amplitudes in SC-CM (n = 4). All ESC amplitudes were normalized with the mean ESC amplitude before SC-CM treatment. The horizontal bar indicates the period when SC-CM was applied. Each data point represents normalized mean ± SEM ESC amplitude.
Figure 7.
Figure 7.
SC-CM enhances the frequency of mEPPs at developing neuromuscular synapses in tadpoles. Intracellular recordings were made on randomly selected pectoral muscle fibers in tadpoles (stage 60–63). The average mEPP frequency increased ∼2-, 17-, and 15-fold after the muscle was in SC-CM for 1, 2, and 3 h, respectively. Each bar represents an average mEPP frequency recorded from 6–12 muscle fibers in SC-CM (gray bar; n = 5 tadpoles) and that in NCM (white bar; n = 3 tadpoles). The first hatched bar represents average mEPP frequency in NCM before the application of SC-CM in the experimental group. For each individual experiment, the mEPP frequency was normalized with the average mEPP frequency in NCM. Each bar represents the mean ± SEM normalized mEPP frequency. CTRL, Control.

References

    1. Allen NJ, Barres BA. Signaling between glia and neurons: focus on synaptic plasticity. Curr Opin Neurobiol. 2005;15:542–548. - PubMed
    1. Araque A, Parpura V, Sanzgiri RP, Haydon PG. Tripartite synapses: glia, the unacknowledged partner. Trends Neurosci. 1999;22:208–215. - PubMed
    1. Astrow SH, Qiang H, Ko CP. Perisynaptic Schwann cells at neuromuscular junctions revealed by a novel monoclonal antibody. J Neurocytol. 1998;27:667–681. - PubMed
    1. Auld DS, Robitaille R. Perisynaptic Schwann cells at the neuromuscular junction: nerve- and activity-dependent contributions to synaptic efficacy, plasticity, and reinnervation. The Neuroscientist. 2003;9:144–157. - PubMed
    1. Beattie EC, Stellwagen D, Morishita W, Bresnahan JC, Ha BK, Von Zastrow M, Beattie MS, Malenka RC. Control of synaptic strength by glial TNFalpha. Science. 2002;295:2282–2285. - PubMed

Publication types

Substances

LinkOut - more resources